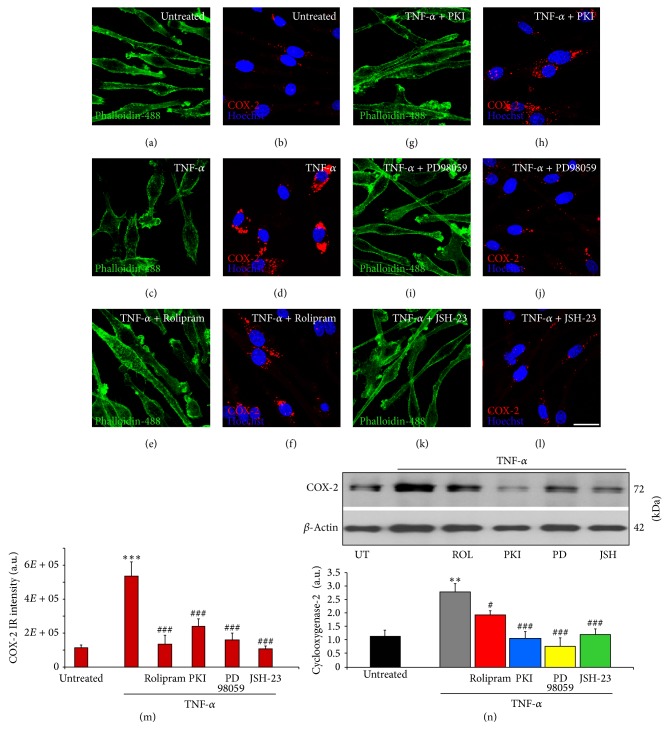
Figure 2.
TNF-α induced increases in COX-2 are perturbed by the inhibition of PDE4, MEK, PKA, or NF-κB p65 in microglia. Unstimulated, resting EOC2 microglia, the morphology of which was demarcated by phalloidin-488 staining ((a) green), showed very little expression of COX-2 ((b) red). Upon stimulation with TNF-α, there was a marked production within 3 h of COX-2 in the cytoplasm (d). Inhibiting PDE4 activity with Rolipram (f), PKA with m-PKI (h), MEK with PD98059 (j), or NF-κB translocation with JSH-23 (l) significantly reduced COX-2 immunoreactivity in TNF-α treated microglial cells. Measurements of COX-2 (red) immunoreactive signal intensity were obtained in microglia using fluorescent microscopy and Image J software for the different imaged conditions (m). Confirmation of changes in COX-2 was then confirmed by immunoblot (n). Quantification of COX-2 levels was performed by densitometry analysis (arbitrary units) normalized to β-actin. Stimulation of microglia with TNF-α (gray bar) produced a significant increase in COX-2 band intensity, recognized at 72 kDa, compared to untreated controls (black bar). Antagonism of PDE4 (red bar), PKA (blue bar), MEK (yellow bar), or NF-κB (green bar) all significantly perturbed the increase in COX-2 observed in microglia after TNF-α stimulation. Results shown are the average from three independent culture plate replicates for each treatment examined. Cell nuclei are visualized using the nuclear stain Hoechst (blue). Scale bar = 20 μm. Errors are given as SEMs. Statistical significance relative to naive controls is indicated at ** P < 0.01 and versus TNF-α stimulated cells at # P < 0.05 or ### P < 0.001.

