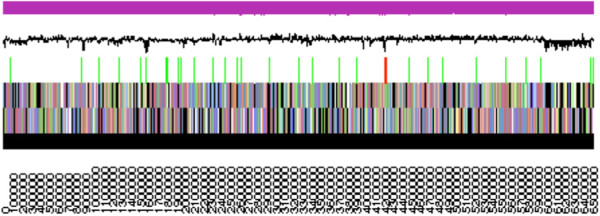
Figure 3.

Graphical map of the single scaffold of Mesorhizobium loti R7A. From bottem to the top: Genes on forward strand (color by COG categories as denoted by the IMG platform), Genes on reverse strand (color by COG categories), RNA genes (tRNAs green, sRNAs red, other RNAs black), GC content, GC skew.
