
Figure 3.
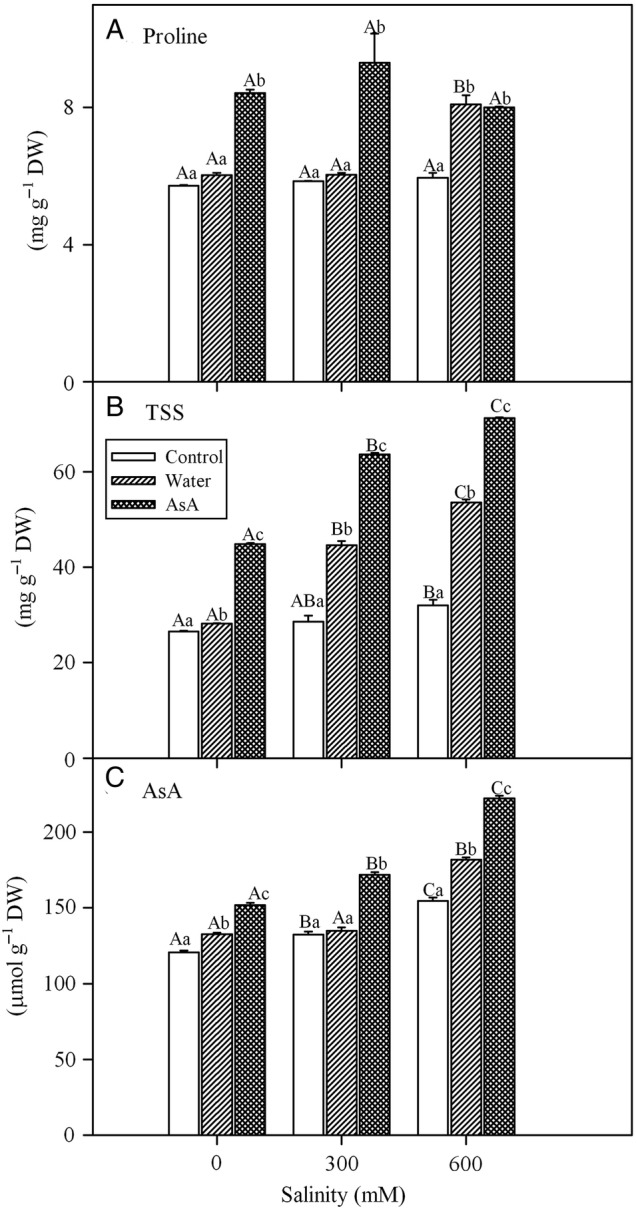
Effect of salinity and exogenous treatments on (A) proline, (B) TSS and (C) reduced ascorbate (AsA) concentrations of L. stocksii leaves. Bars represent mean ± standard error. Different capital letters across salinity treatments and small letters within each salinity level are significantly different from each other (P < 0.05; Bonferroni test).