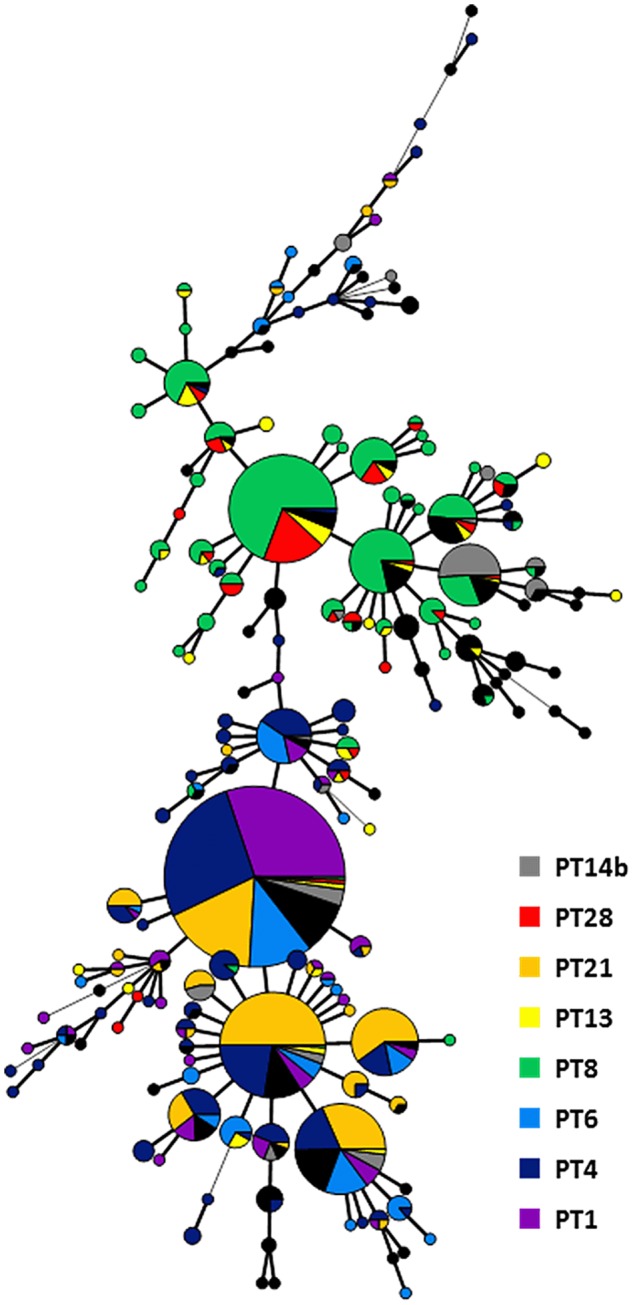
Fig 3. Minimal spanning tree calculated of MLVA profiles of S. Enteritidis isolates over the 6-year period.

Each node represents a different MLVA profile with frequency-dependent size. Node colour represents phage type: Branch thickness indicates how many loci are different in the MLVA profiles of the connected nodes. Thick solid lines connect nodes that differ by one MLVA locus, thin solid lines connect nodes that differ by two MLVA loci and dashed lines connect nodes that differ by three MLVA loci.
