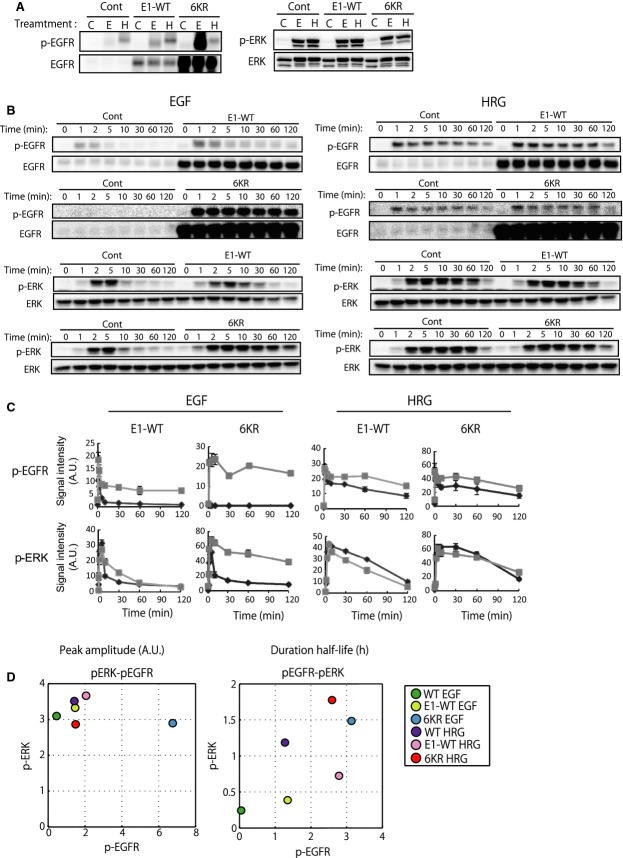
Figure 2.
Phosphorylation of EGFR and ERK in control, wild-type EGFR (E1-WT) or 6KR-EGFR (6KR) expressing MCF-7 cells in response to EGF and HRG stimulation. (A) Levels of EGFR phosphorylation (at 2 min) (left) and ERK phosphorylation (at 5 min) (right) in the three cell lines. C, control, no stimuli; E, EGF; H, HRG). (B) Time-course phosphorylation of EGFR and ERK for up to 2 h of ligand EGF (left) and HRG (right)-stimulated cells. Time-course cell lysates of control MCF-7 cells and E1-WT or 6KR cells were loaded side by side. Representative images for two independent experiments are shown. (C) Time-course graphic representation of the data in (B). Black lines, control cells; grey lines, E1-WT or 6KR cells. (D) Quantitative relationship between EGFR and ERK phosphorylation. Amplitudes of EGFR and ERK phosphorylation obtained from (A) were plotted (left). Duration half-lives of phosphorylation were calculated from the phosphorylation time-course (B), as described in the Materials and methods, and then plotted (right). Colored circles show the corresponding cells and conditions. Average values of two independent experiments are shown.

