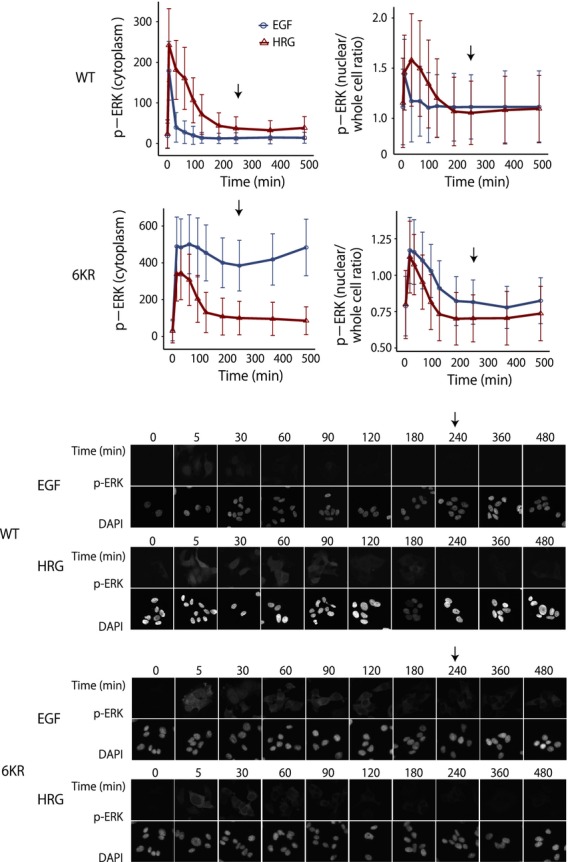
Figure 6.

Time-course analysis of phospho-ERK localization at the single cell level. (A) Quantification of phospho-ERK in cytosol (left) and nuclear/whole cell ratio (right) of wild-type (upper) and 6KR (bottom) cells up to 8 h after ligand stimulation. At each time point, 1200–2000 cells were analyzed and average values were obtained. The bar denotes the SD. EGF (blue) and HRG (red). Arrow indicates the 4-h time point. (B) Representative images of phospho-ERK immunostaining (top) and DAPI staining (middle) for each condition.
