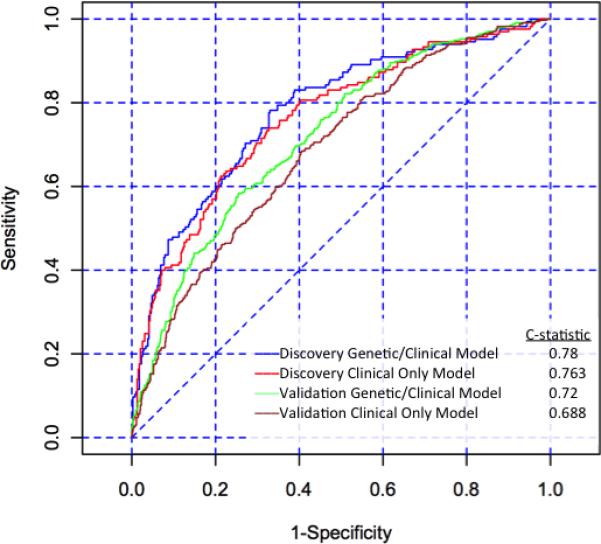
Figure 1A.

Receiver operator characteristic (ROC) curves for the discovery cohort combined clinical/genetic model (blue line, area under the ROC curve 0.78), discovery cohort clinical-only model (red line, area under the ROC curve 0.763), validation cohort combined clinical/ genetic model (green line, area under the ROC curve 0.72), and validation cohort clinical-only model (brown line, area under the ROC curve 0.688).
