
Figure 1B.
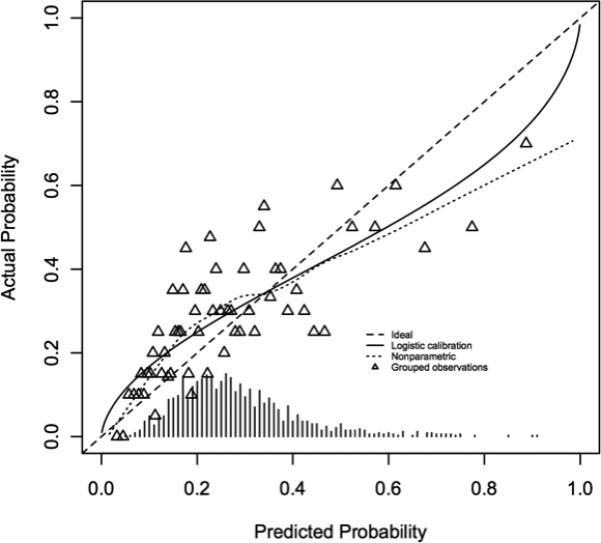
Calibration curve for the validation cohort combined clinical/genetic model. Patients were grouped based on predicted probability of developing post operative atrial fibrillation, predicted probabilities were plotted against actual probabilities, and a curve was fit to the data. For an ideal prediction model, this curve would represent a straight line with slope equal to 1.