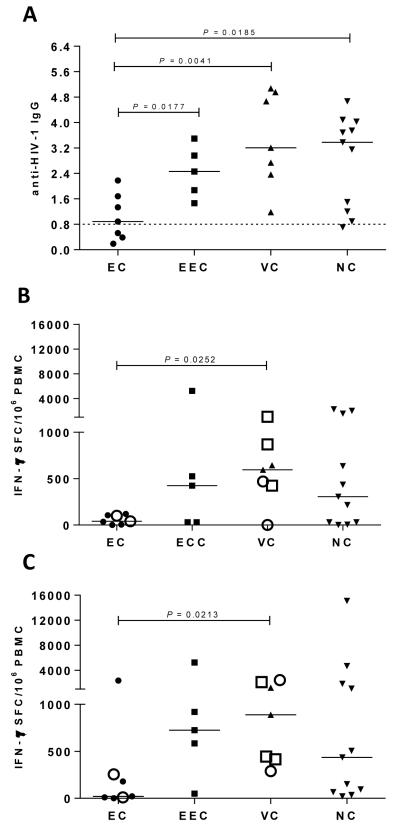
Figure 4.
Evaluation of HIV-1 specific responses. Proportion of anti-HIV-1 IgG determined by BED-CEIA found in Elite Controllers (EC), Ebbing Elite Controllers (EEC), Viremic Controllers (VC) and Non-Controllers (NC) (A). Gag- (B) and Nef- (C) specific PBMC responses among Elite Controllers (EC), Ebbing Elite Controllers (EEC), Viremic Controllers (VC) and Non-Controllers (NC) by IFN-γ ELISpot (SFC/106 PBMC). Open circles represent patients with B*57 and open squares represent patients with B*27 alelles. Horizontal dashed line represents the conventional cut-off value (0.8) below which a sample is classified as recent infection (153-day window period) based on the low proportion of HIV-specific IgG in the serum/plasma. The horizontal bars denote median values. P values for comparison between two groups were calculated using a 2-tailed Mann-Whitney test.

