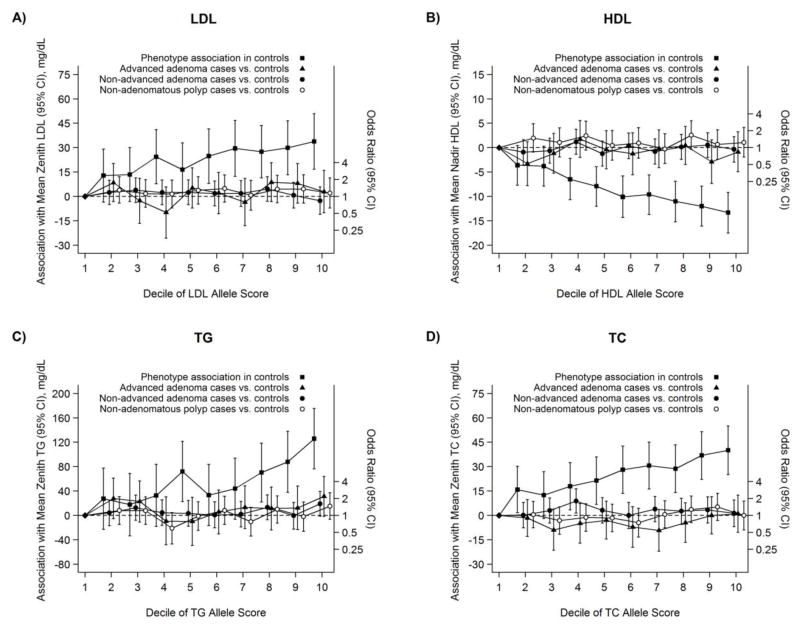
Fig. 1.
Estimated difference in mean value of the blood lipid phenotypes (zenith LDL in A, nadir HDL in B, zenith TG in C, and zenith TC in D) comparing deciles of the allele score in controls to the first decile (black squares; plotted with respect to left Y-axis), Group Health, 1998–2007. Estimated odds ratios of advanced adenomas vs. controls (black triangles), non-advanced adenomas vs. controls (black circles), and non-adenomatous polyps vs. controls (white circles) are adjusted for age, sex, race, and data-collection period; 95% CIs shown.

