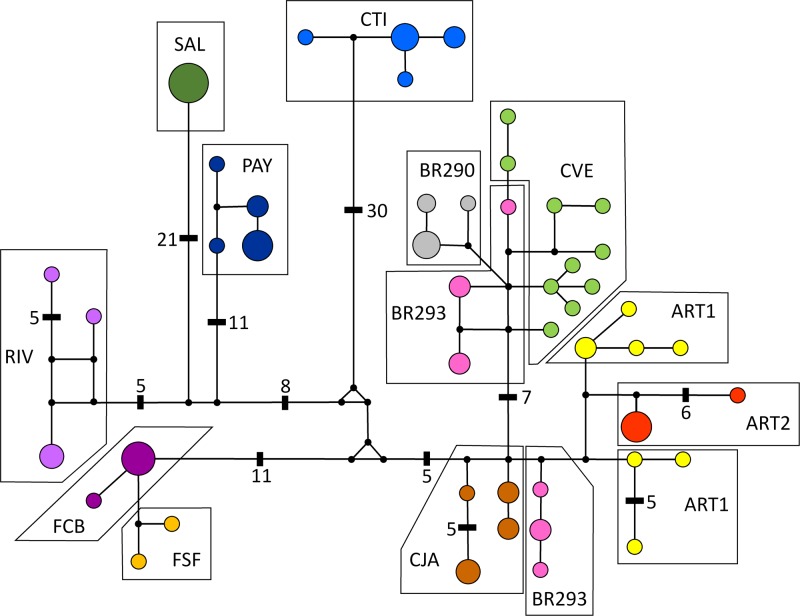
Fig 3. Haplotype network obtained under the median-joining method.
Population labels are given according to Table 1. The size of each circle is proportional to haplotype frequency. Median vectors are represented by small back circles. All lines represent one mutational step except when noted.

