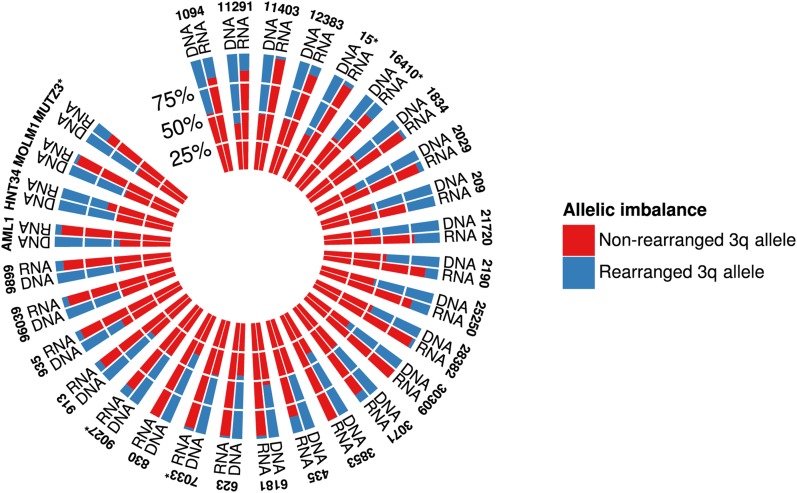
Figure 3.
Polar histogram plot of allelic imbalance of GATA2 expression observed in RNA-Seq. For each patient, the average VAF is estimated from informative heterozygous SNVs from 3q-Seq data. Average RNA-Seq GATA2 VAF is estimated from the same SNV positions. Asterisks denote the presence of a somatic GATA2 mutation in the indicated sample.

