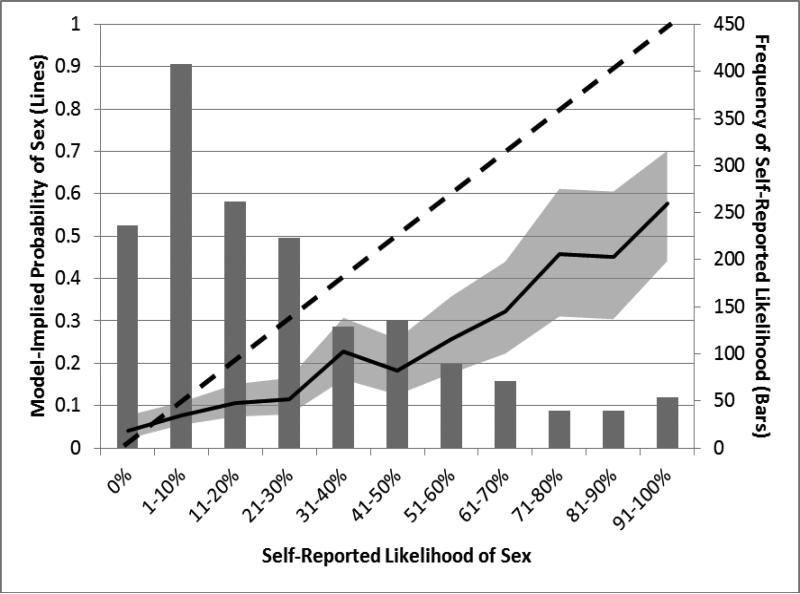
Figure 1.
This figure displays a histogram of the frequency of self-reported likelihood within the bar chart while also displaying the model-implied probability of anal sex with a casual partner based on 11 percentiles of self-reported likelihood as a solid black line (the 95% confidence interval for the predicted values is displayed as a gray shadow around the solid line). The dotted black line serves as a referent for what a line of perfect correspondence between reported likelihood and actual behavior. As can be seen, participants tended towards lower predictions regarding the likelihood of sex on the next day, and the association between self-reported likelihood and subsequent engagement in sex was relatively linear.

