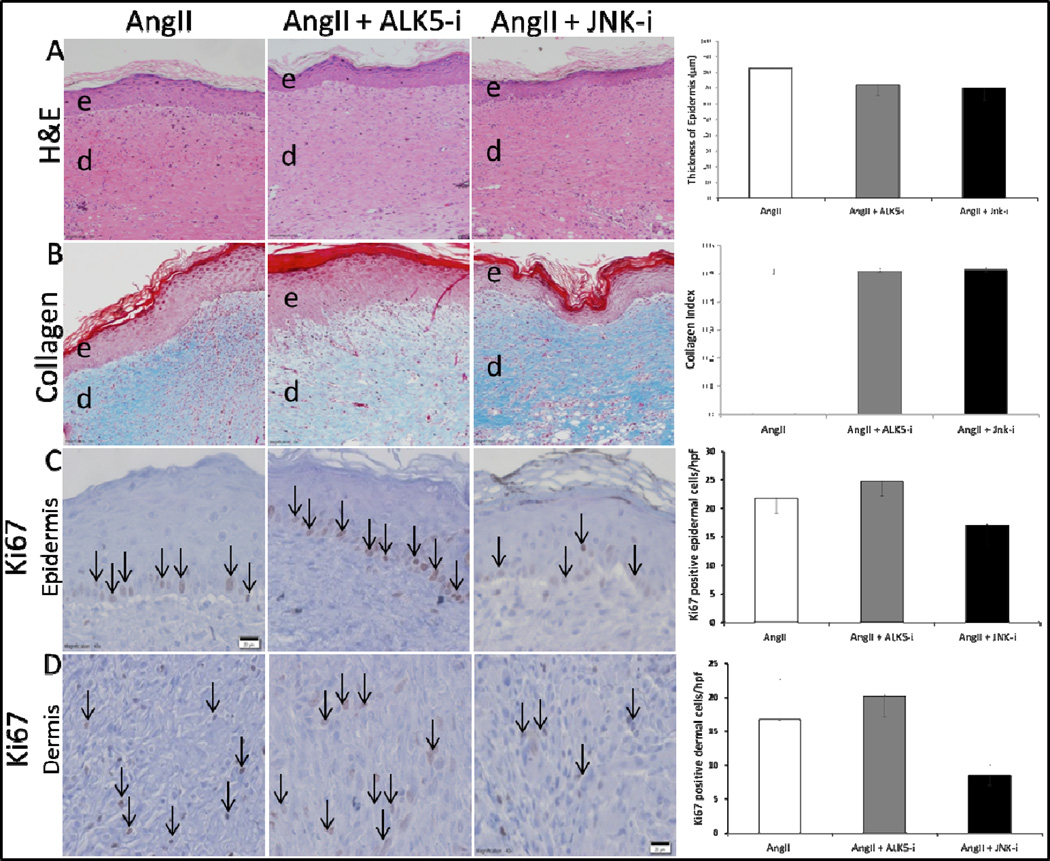
Figure 8. Neither ALK5 nor JNK inhibition significantly affected epithelialization, collagen deposition, or cell proliferation.
Representative images of H&E (20× - scale bars represent 100μm), Masson’s Trichrome (20× - scale bars represent 100μm), and Ki67 (40× - scale bars represent 50μm) at 14 days after injury. Masson’s Trichrome staining was quantified by the average collagen index of 5 HPF images for each time point. The collagen index value, ranging from 0 for extremely red objects to 1 for completely blue-green objects, was determined by colorimetric analysis where collagen index = (B+G)/(2R+B+G) for each pixel within the image (R, G, and B represent the red, blue, and green pixel values respectively). There was no statistically significant difference between AngII alone, AngII + ALK5 inhibitor, or AngII + JNK inhibitor in wound bed epithelialization (A), collagen deposition (B), or cell proliferation in the epidermis (C), and dermis (D). Black arrows indicate representative Ki-67 positive cells. Each data point represents mean ±SEM, n=5.

