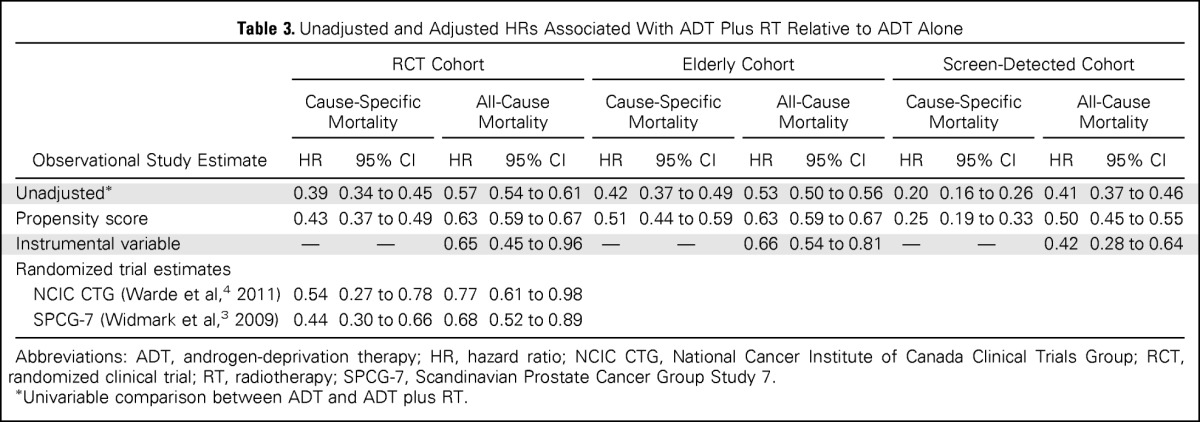
Table 3.
Unadjusted and Adjusted HRs Associated With ADT Plus RT Relative to ADT Alone

| Observational Study Estimate | RCT Cohort |
Elderly Cohort |
Screen-Detected Cohort |
|||||||||
|---|---|---|---|---|---|---|---|---|---|---|---|---|
| Cause-Specific Mortality |
All-Cause Mortality |
Cause-Specific Mortality |
All-Cause Mortality |
Cause-Specific Mortality |
All-Cause Mortality |
|||||||
| HR | 95% CI | HR | 95% CI | HR | 95% CI | HR | 95% CI | HR | 95% CI | HR | 95% CI | |
| Unadjusted* | 0.39 | 0.34 to 0.45 | 0.57 | 0.54 to 0.61 | 0.42 | 0.37 to 0.49 | 0.53 | 0.50 to 0.56 | 0.20 | 0.16 to 0.26 | 0.41 | 0.37 to 0.46 |
| Propensity score | 0.43 | 0.37 to 0.49 | 0.63 | 0.59 to 0.67 | 0.51 | 0.44 to 0.59 | 0.63 | 0.59 to 0.67 | 0.25 | 0.19 to 0.33 | 0.50 | 0.45 to 0.55 |
| Instrumental variable | — | — | 0.65 | 0.45 to 0.96 | — | — | 0.66 | 0.54 to 0.81 | — | — | 0.42 | 0.28 to 0.64 |
| Randomized trial estimates | ||||||||||||
| NCIC CTG (Warde et al,4 2011) | 0.54 | 0.27 to 0.78 | 0.77 | 0.61 to 0.98 | ||||||||
| SPCG-7 (Widmark et al,3 2009) | 0.44 | 0.30 to 0.66 | 0.68 | 0.52 to 0.89 | ||||||||
Abbreviations: ADT, androgen-deprivation therapy; HR, hazard ratio; NCIC CTG, National Cancer Institute of Canada Clinical Trials Group; RCT, randomized clinical trial; RT, radiotherapy; SPCG-7, Scandinavian Prostate Cancer Group Study 7.
Univariable comparison between ADT and ADT plus RT.
