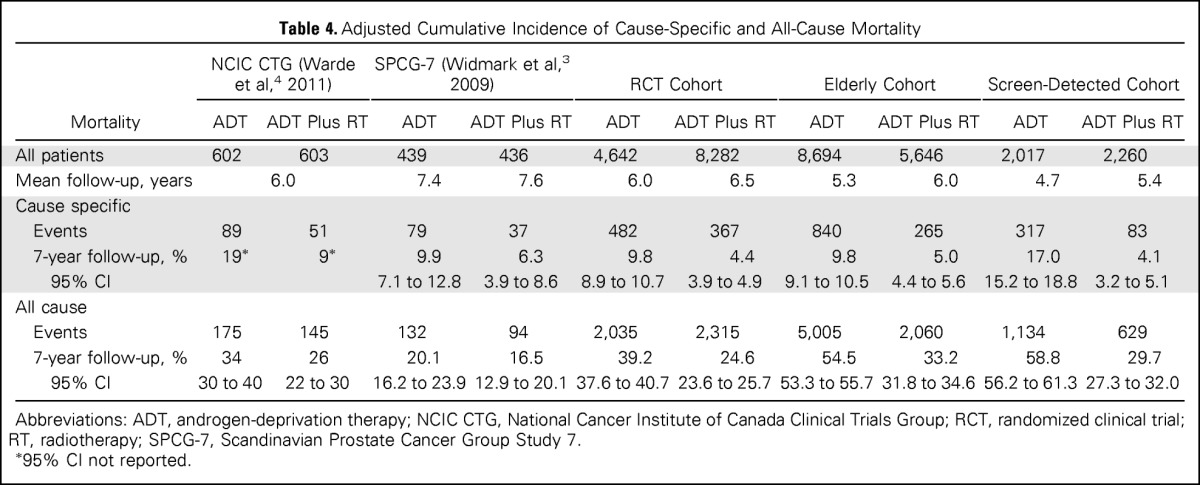
Table 4.
Adjusted Cumulative Incidence of Cause-Specific and All-Cause Mortality

| Mortality | NCIC CTG (Warde et al,4 2011) |
SPCG-7 (Widmark et al,3 2009) |
RCT Cohort |
Elderly Cohort |
Screen-Detected Cohort |
|||||
|---|---|---|---|---|---|---|---|---|---|---|
| ADT | ADT Plus RT | ADT | ADT Plus RT | ADT | ADT Plus RT | ADT | ADT Plus RT | ADT | ADT Plus RT | |
| All patients | 602 | 603 | 439 | 436 | 4,642 | 8,282 | 8,694 | 5,646 | 2,017 | 2,260 |
| Mean follow-up, years | 6.0 | 7.4 | 7.6 | 6.0 | 6.5 | 5.3 | 6.0 | 4.7 | 5.4 | |
| Cause specific | ||||||||||
| Events | 89 | 51 | 79 | 37 | 482 | 367 | 840 | 265 | 317 | 83 |
| 7-year follow-up, % | 19* | 9* | 9.9 | 6.3 | 9.8 | 4.4 | 9.8 | 5.0 | 17.0 | 4.1 |
| 95% CI | 7.1 to 12.8 | 3.9 to 8.6 | 8.9 to 10.7 | 3.9 to 4.9 | 9.1 to 10.5 | 4.4 to 5.6 | 15.2 to 18.8 | 3.2 to 5.1 | ||
| All cause | ||||||||||
| Events | 175 | 145 | 132 | 94 | 2,035 | 2,315 | 5,005 | 2,060 | 1,134 | 629 |
| 7-year follow-up, % | 34 | 26 | 20.1 | 16.5 | 39.2 | 24.6 | 54.5 | 33.2 | 58.8 | 29.7 |
| 95% CI | 30 to 40 | 22 to 30 | 16.2 to 23.9 | 12.9 to 20.1 | 37.6 to 40.7 | 23.6 to 25.7 | 53.3 to 55.7 | 31.8 to 34.6 | 56.2 to 61.3 | 27.3 to 32.0 |
Abbreviations: ADT, androgen-deprivation therapy; NCIC CTG, National Cancer Institute of Canada Clinical Trials Group; RCT, randomized clinical trial; RT, radiotherapy; SPCG-7, Scandinavian Prostate Cancer Group Study 7.
95% CI not reported.
