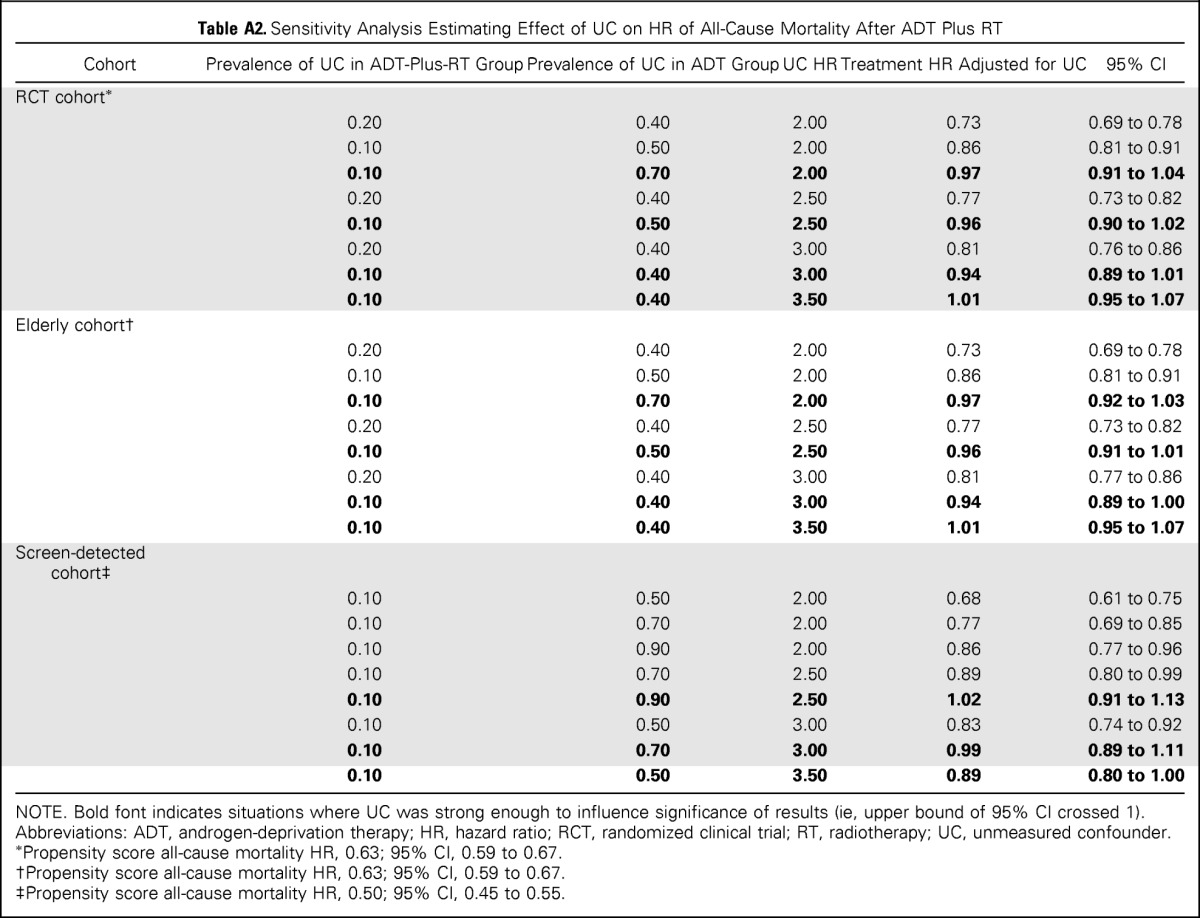
Table A2.
Sensitivity Analysis Estimating Effect of UC on HR of All-Cause Mortality After ADT Plus RT

| Cohort | Prevalence of UC in ADT-Plus-RT Group | Prevalence of UC in ADT Group | UC HR | Treatment HR Adjusted for UC | 95% CI |
|---|---|---|---|---|---|
| RCT cohort* | |||||
| 0.20 | 0.40 | 2.00 | 0.73 | 0.69 to 0.78 | |
| 0.10 | 0.50 | 2.00 | 0.86 | 0.81 to 0.91 | |
| 0.10 | 0.70 | 2.00 | 0.97 | 0.91 to 1.04 | |
| 0.20 | 0.40 | 2.50 | 0.77 | 0.73 to 0.82 | |
| 0.10 | 0.50 | 2.50 | 0.96 | 0.90 to 1.02 | |
| 0.20 | 0.40 | 3.00 | 0.81 | 0.76 to 0.86 | |
| 0.10 | 0.40 | 3.00 | 0.94 | 0.89 to 1.01 | |
| 0.10 | 0.40 | 3.50 | 1.01 | 0.95 to 1.07 | |
| Elderly cohort† | |||||
| 0.20 | 0.40 | 2.00 | 0.73 | 0.69 to 0.78 | |
| 0.10 | 0.50 | 2.00 | 0.86 | 0.81 to 0.91 | |
| 0.10 | 0.70 | 2.00 | 0.97 | 0.92 to 1.03 | |
| 0.20 | 0.40 | 2.50 | 0.77 | 0.73 to 0.82 | |
| 0.10 | 0.50 | 2.50 | 0.96 | 0.91 to 1.01 | |
| 0.20 | 0.40 | 3.00 | 0.81 | 0.77 to 0.86 | |
| 0.10 | 0.40 | 3.00 | 0.94 | 0.89 to 1.00 | |
| 0.10 | 0.40 | 3.50 | 1.01 | 0.95 to 1.07 | |
| Screen-detected cohort‡ | |||||
| 0.10 | 0.50 | 2.00 | 0.68 | 0.61 to 0.75 | |
| 0.10 | 0.70 | 2.00 | 0.77 | 0.69 to 0.85 | |
| 0.10 | 0.90 | 2.00 | 0.86 | 0.77 to 0.96 | |
| 0.10 | 0.70 | 2.50 | 0.89 | 0.80 to 0.99 | |
| 0.10 | 0.90 | 2.50 | 1.02 | 0.91 to 1.13 | |
| 0.10 | 0.50 | 3.00 | 0.83 | 0.74 to 0.92 | |
| 0.10 | 0.70 | 3.00 | 0.99 | 0.89 to 1.11 | |
| 0.10 | 0.50 | 3.50 | 0.89 | 0.80 to 1.00 |
NOTE. Bold font indicates situations where UC was strong enough to influence significance of results (ie, upper bound of 95% CI crossed 1).
Abbreviations: ADT, androgen-deprivation therapy; HR, hazard ratio; RCT, randomized clinical trial; RT, radiotherapy; UC, unmeasured confounder.
Propensity score all-cause mortality HR, 0.63; 95% CI, 0.59 to 0.67.
Propensity score all-cause mortality HR, 0.63; 95% CI, 0.59 to 0.67.
Propensity score all-cause mortality HR, 0.50; 95% CI, 0.45 to 0.55.
