
Table 2.
Descriptive Statistics for PRO Measures at Each Time Point by Treatment Arm
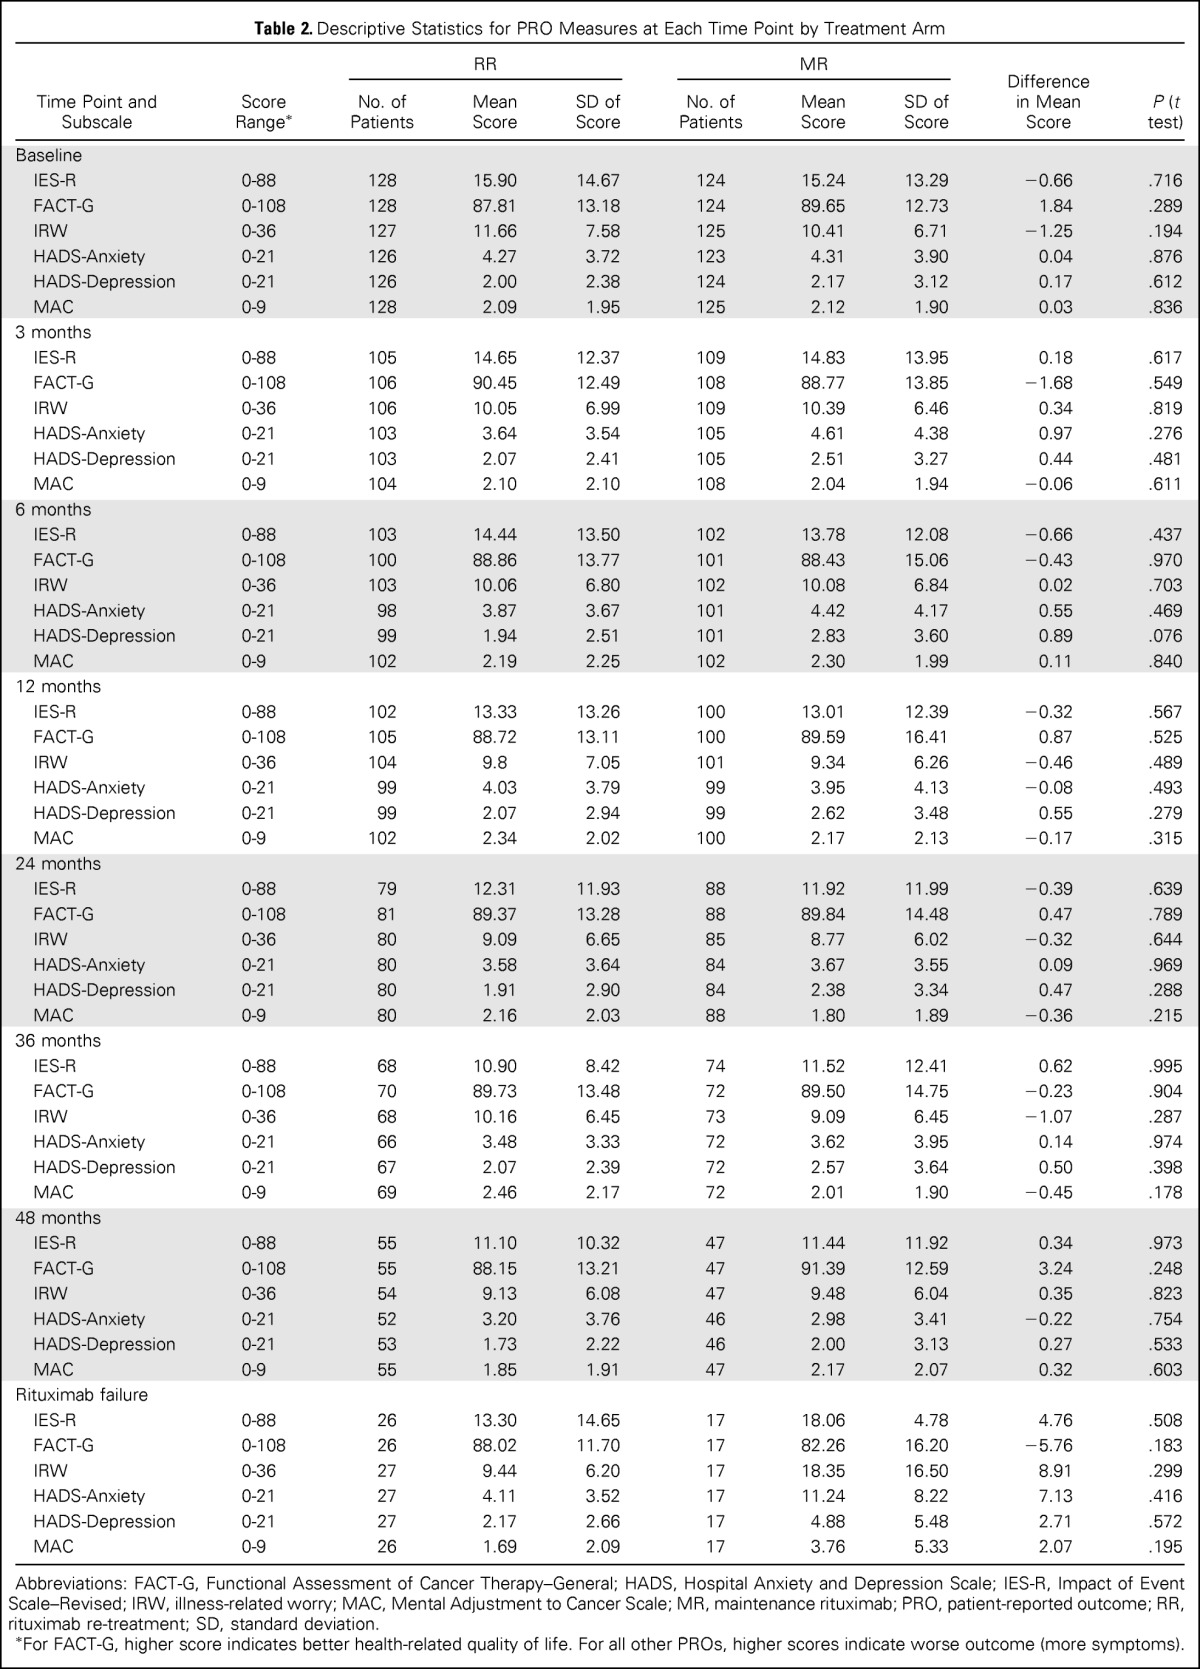
| Time Point and Subscale | Score Range* | RR |
MR |
Difference in Mean Score | P (t test) | ||||
|---|---|---|---|---|---|---|---|---|---|
| No. of Patients | Mean Score | SD of Score | No. of Patients | Mean Score | SD of Score | ||||
| Baseline | |||||||||
| IES-R | 0-88 | 128 | 15.90 | 14.67 | 124 | 15.24 | 13.29 | −0.66 | .716 |
| FACT-G | 0-108 | 128 | 87.81 | 13.18 | 124 | 89.65 | 12.73 | 1.84 | .289 |
| IRW | 0-36 | 127 | 11.66 | 7.58 | 125 | 10.41 | 6.71 | −1.25 | .194 |
| HADS-Anxiety | 0-21 | 126 | 4.27 | 3.72 | 123 | 4.31 | 3.90 | 0.04 | .876 |
| HADS-Depression | 0-21 | 126 | 2.00 | 2.38 | 124 | 2.17 | 3.12 | 0.17 | .612 |
| MAC | 0-9 | 128 | 2.09 | 1.95 | 125 | 2.12 | 1.90 | 0.03 | .836 |
| 3 months | |||||||||
| IES-R | 0-88 | 105 | 14.65 | 12.37 | 109 | 14.83 | 13.95 | 0.18 | .617 |
| FACT-G | 0-108 | 106 | 90.45 | 12.49 | 108 | 88.77 | 13.85 | −1.68 | .549 |
| IRW | 0-36 | 106 | 10.05 | 6.99 | 109 | 10.39 | 6.46 | 0.34 | .819 |
| HADS-Anxiety | 0-21 | 103 | 3.64 | 3.54 | 105 | 4.61 | 4.38 | 0.97 | .276 |
| HADS-Depression | 0-21 | 103 | 2.07 | 2.41 | 105 | 2.51 | 3.27 | 0.44 | .481 |
| MAC | 0-9 | 104 | 2.10 | 2.10 | 108 | 2.04 | 1.94 | −0.06 | .611 |
| 6 months | |||||||||
| IES-R | 0-88 | 103 | 14.44 | 13.50 | 102 | 13.78 | 12.08 | −0.66 | .437 |
| FACT-G | 0-108 | 100 | 88.86 | 13.77 | 101 | 88.43 | 15.06 | −0.43 | .970 |
| IRW | 0-36 | 103 | 10.06 | 6.80 | 102 | 10.08 | 6.84 | 0.02 | .703 |
| HADS-Anxiety | 0-21 | 98 | 3.87 | 3.67 | 101 | 4.42 | 4.17 | 0.55 | .469 |
| HADS-Depression | 0-21 | 99 | 1.94 | 2.51 | 101 | 2.83 | 3.60 | 0.89 | .076 |
| MAC | 0-9 | 102 | 2.19 | 2.25 | 102 | 2.30 | 1.99 | 0.11 | .840 |
| 12 months | |||||||||
| IES-R | 0-88 | 102 | 13.33 | 13.26 | 100 | 13.01 | 12.39 | −0.32 | .567 |
| FACT-G | 0-108 | 105 | 88.72 | 13.11 | 100 | 89.59 | 16.41 | 0.87 | .525 |
| IRW | 0-36 | 104 | 9.8 | 7.05 | 101 | 9.34 | 6.26 | −0.46 | .489 |
| HADS-Anxiety | 0-21 | 99 | 4.03 | 3.79 | 99 | 3.95 | 4.13 | −0.08 | .493 |
| HADS-Depression | 0-21 | 99 | 2.07 | 2.94 | 99 | 2.62 | 3.48 | 0.55 | .279 |
| MAC | 0-9 | 102 | 2.34 | 2.02 | 100 | 2.17 | 2.13 | −0.17 | .315 |
| 24 months | |||||||||
| IES-R | 0-88 | 79 | 12.31 | 11.93 | 88 | 11.92 | 11.99 | −0.39 | .639 |
| FACT-G | 0-108 | 81 | 89.37 | 13.28 | 88 | 89.84 | 14.48 | 0.47 | .789 |
| IRW | 0-36 | 80 | 9.09 | 6.65 | 85 | 8.77 | 6.02 | −0.32 | .644 |
| HADS-Anxiety | 0-21 | 80 | 3.58 | 3.64 | 84 | 3.67 | 3.55 | 0.09 | .969 |
| HADS-Depression | 0-21 | 80 | 1.91 | 2.90 | 84 | 2.38 | 3.34 | 0.47 | .288 |
| MAC | 0-9 | 80 | 2.16 | 2.03 | 88 | 1.80 | 1.89 | −0.36 | .215 |
| 36 months | |||||||||
| IES-R | 0-88 | 68 | 10.90 | 8.42 | 74 | 11.52 | 12.41 | 0.62 | .995 |
| FACT-G | 0-108 | 70 | 89.73 | 13.48 | 72 | 89.50 | 14.75 | −0.23 | .904 |
| IRW | 0-36 | 68 | 10.16 | 6.45 | 73 | 9.09 | 6.45 | −1.07 | .287 |
| HADS-Anxiety | 0-21 | 66 | 3.48 | 3.33 | 72 | 3.62 | 3.95 | 0.14 | .974 |
| HADS-Depression | 0-21 | 67 | 2.07 | 2.39 | 72 | 2.57 | 3.64 | 0.50 | .398 |
| MAC | 0-9 | 69 | 2.46 | 2.17 | 72 | 2.01 | 1.90 | −0.45 | .178 |
| 48 months | |||||||||
| IES-R | 0-88 | 55 | 11.10 | 10.32 | 47 | 11.44 | 11.92 | 0.34 | .973 |
| FACT-G | 0-108 | 55 | 88.15 | 13.21 | 47 | 91.39 | 12.59 | 3.24 | .248 |
| IRW | 0-36 | 54 | 9.13 | 6.08 | 47 | 9.48 | 6.04 | 0.35 | .823 |
| HADS-Anxiety | 0-21 | 52 | 3.20 | 3.76 | 46 | 2.98 | 3.41 | −0.22 | .754 |
| HADS-Depression | 0-21 | 53 | 1.73 | 2.22 | 46 | 2.00 | 3.13 | 0.27 | .533 |
| MAC | 0-9 | 55 | 1.85 | 1.91 | 47 | 2.17 | 2.07 | 0.32 | .603 |
| Rituximab failure | |||||||||
| IES-R | 0-88 | 26 | 13.30 | 14.65 | 17 | 18.06 | 4.78 | 4.76 | .508 |
| FACT-G | 0-108 | 26 | 88.02 | 11.70 | 17 | 82.26 | 16.20 | −5.76 | .183 |
| IRW | 0-36 | 27 | 9.44 | 6.20 | 17 | 18.35 | 16.50 | 8.91 | .299 |
| HADS-Anxiety | 0-21 | 27 | 4.11 | 3.52 | 17 | 11.24 | 8.22 | 7.13 | .416 |
| HADS-Depression | 0-21 | 27 | 2.17 | 2.66 | 17 | 4.88 | 5.48 | 2.71 | .572 |
| MAC | 0-9 | 26 | 1.69 | 2.09 | 17 | 3.76 | 5.33 | 2.07 | .195 |
Abbreviations: FACT-G, Functional Assessment of Cancer Therapy–General; HADS, Hospital Anxiety and Depression Scale; IES-R, Impact of Event Scale–Revised; IRW, illness-related worry; MAC, Mental Adjustment to Cancer Scale; MR, maintenance rituximab; PRO, patient-reported outcome; RR, rituximab re-treatment; SD, standard deviation.
*
For FACT-G, higher score indicates better health-related quality of life. For all other PROs, higher scores indicate worse outcome (more symptoms).