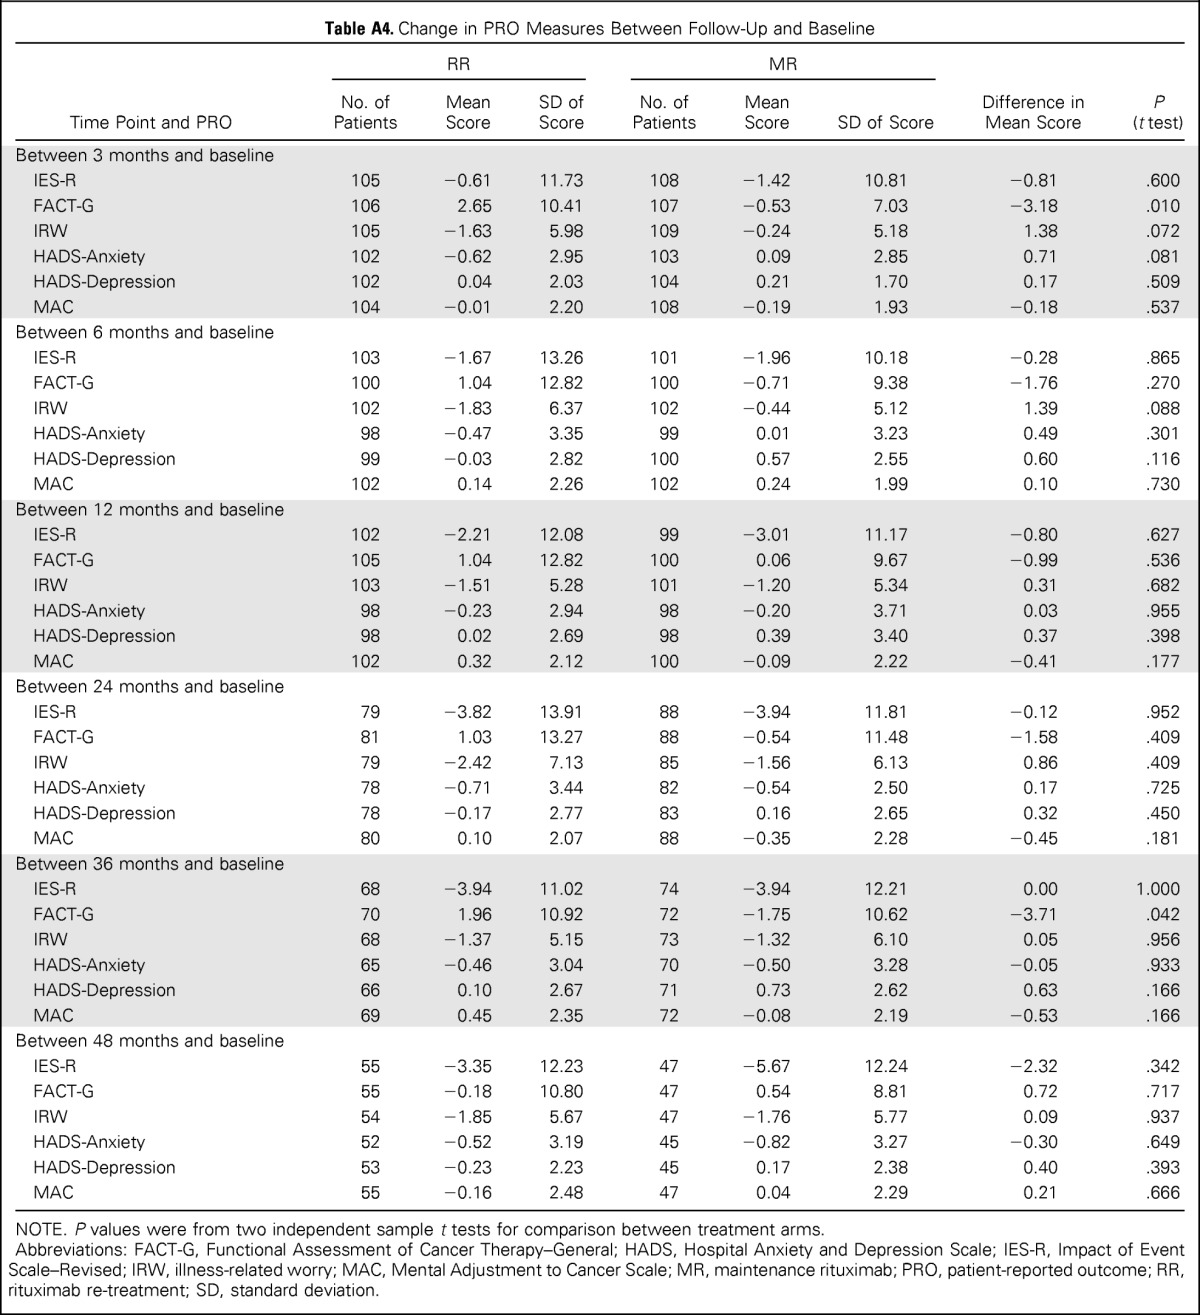
Table A4.
Change in PRO Measures Between Follow-Up and Baseline

| Time Point and PRO | RR |
MR |
Difference in Mean Score | P (t test) | ||||
|---|---|---|---|---|---|---|---|---|
| No. of Patients | Mean Score | SD of Score | No. of Patients | Mean Score | SD of Score | |||
| Between 3 months and baseline | ||||||||
| IES-R | 105 | −0.61 | 11.73 | 108 | −1.42 | 10.81 | −0.81 | .600 |
| FACT-G | 106 | 2.65 | 10.41 | 107 | −0.53 | 7.03 | −3.18 | .010 |
| IRW | 105 | −1.63 | 5.98 | 109 | −0.24 | 5.18 | 1.38 | .072 |
| HADS-Anxiety | 102 | −0.62 | 2.95 | 103 | 0.09 | 2.85 | 0.71 | .081 |
| HADS-Depression | 102 | 0.04 | 2.03 | 104 | 0.21 | 1.70 | 0.17 | .509 |
| MAC | 104 | −0.01 | 2.20 | 108 | −0.19 | 1.93 | −0.18 | .537 |
| Between 6 months and baseline | ||||||||
| IES-R | 103 | −1.67 | 13.26 | 101 | −1.96 | 10.18 | −0.28 | .865 |
| FACT-G | 100 | 1.04 | 12.82 | 100 | −0.71 | 9.38 | −1.76 | .270 |
| IRW | 102 | −1.83 | 6.37 | 102 | −0.44 | 5.12 | 1.39 | .088 |
| HADS-Anxiety | 98 | −0.47 | 3.35 | 99 | 0.01 | 3.23 | 0.49 | .301 |
| HADS-Depression | 99 | −0.03 | 2.82 | 100 | 0.57 | 2.55 | 0.60 | .116 |
| MAC | 102 | 0.14 | 2.26 | 102 | 0.24 | 1.99 | 0.10 | .730 |
| Between 12 months and baseline | ||||||||
| IES-R | 102 | −2.21 | 12.08 | 99 | −3.01 | 11.17 | −0.80 | .627 |
| FACT-G | 105 | 1.04 | 12.82 | 100 | 0.06 | 9.67 | −0.99 | .536 |
| IRW | 103 | −1.51 | 5.28 | 101 | −1.20 | 5.34 | 0.31 | .682 |
| HADS-Anxiety | 98 | −0.23 | 2.94 | 98 | −0.20 | 3.71 | 0.03 | .955 |
| HADS-Depression | 98 | 0.02 | 2.69 | 98 | 0.39 | 3.40 | 0.37 | .398 |
| MAC | 102 | 0.32 | 2.12 | 100 | −0.09 | 2.22 | −0.41 | .177 |
| Between 24 months and baseline | ||||||||
| IES-R | 79 | −3.82 | 13.91 | 88 | −3.94 | 11.81 | −0.12 | .952 |
| FACT-G | 81 | 1.03 | 13.27 | 88 | −0.54 | 11.48 | −1.58 | .409 |
| IRW | 79 | −2.42 | 7.13 | 85 | −1.56 | 6.13 | 0.86 | .409 |
| HADS-Anxiety | 78 | −0.71 | 3.44 | 82 | −0.54 | 2.50 | 0.17 | .725 |
| HADS-Depression | 78 | −0.17 | 2.77 | 83 | 0.16 | 2.65 | 0.32 | .450 |
| MAC | 80 | 0.10 | 2.07 | 88 | −0.35 | 2.28 | −0.45 | .181 |
| Between 36 months and baseline | ||||||||
| IES-R | 68 | −3.94 | 11.02 | 74 | −3.94 | 12.21 | 0.00 | 1.000 |
| FACT-G | 70 | 1.96 | 10.92 | 72 | −1.75 | 10.62 | −3.71 | .042 |
| IRW | 68 | −1.37 | 5.15 | 73 | −1.32 | 6.10 | 0.05 | .956 |
| HADS-Anxiety | 65 | −0.46 | 3.04 | 70 | −0.50 | 3.28 | −0.05 | .933 |
| HADS-Depression | 66 | 0.10 | 2.67 | 71 | 0.73 | 2.62 | 0.63 | .166 |
| MAC | 69 | 0.45 | 2.35 | 72 | −0.08 | 2.19 | −0.53 | .166 |
| Between 48 months and baseline | ||||||||
| IES-R | 55 | −3.35 | 12.23 | 47 | −5.67 | 12.24 | −2.32 | .342 |
| FACT-G | 55 | −0.18 | 10.80 | 47 | 0.54 | 8.81 | 0.72 | .717 |
| IRW | 54 | −1.85 | 5.67 | 47 | −1.76 | 5.77 | 0.09 | .937 |
| HADS-Anxiety | 52 | −0.52 | 3.19 | 45 | −0.82 | 3.27 | −0.30 | .649 |
| HADS-Depression | 53 | −0.23 | 2.23 | 45 | 0.17 | 2.38 | 0.40 | .393 |
| MAC | 55 | −0.16 | 2.48 | 47 | 0.04 | 2.29 | 0.21 | .666 |
NOTE. P values were from two independent sample t tests for comparison between treatment arms.
Abbreviations: FACT-G, Functional Assessment of Cancer Therapy–General; HADS, Hospital Anxiety and Depression Scale; IES-R, Impact of Event Scale–Revised; IRW, illness-related worry; MAC, Mental Adjustment to Cancer Scale; MR, maintenance rituximab; PRO, patient-reported outcome; RR, rituximab re-treatment; SD, standard deviation.
