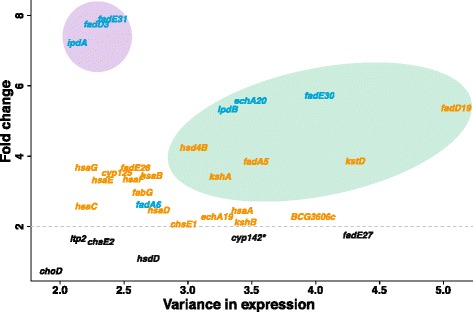
Figure 4.

Variance in expression levels (compendium) compared to the fold changes upon infection. Genes in blue are KstR2-regulated whereas orange genes denote KstR-regulated genes. Genes in black show no significant change (FDR > 0.05). Green/violet ellipses denote areas of high/low variability in the expression compendium. *In M. tuberculosis H37Rv, cyp142 has the same function as cyp125. In M. bovis BCG, cyp142 encodes an inactive product.
