Figure 5.
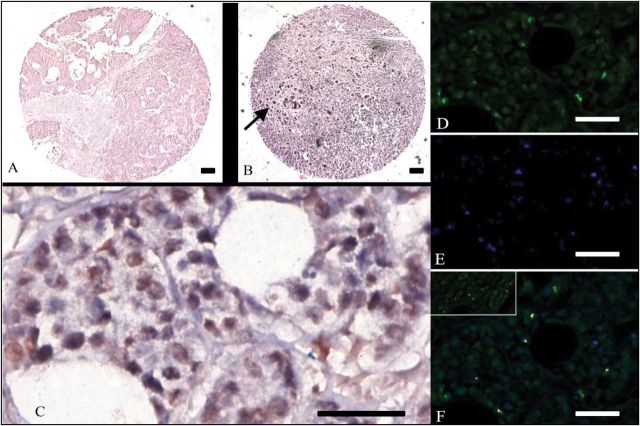
MIR302a microRNAs and BMI1 expression in invasive ductal carcinoma with metastasis (validation cohort). Panels A and B show cores of a TMA from patients with breast cancer and no metastases (panel A) or with lymph node metastases (panel B). Note that the former has no detectable hsa-miR-302a positive cells, whereas the latter core has multiple cancer cells with a high level of hsa-miR-302a (arrow). Panel C shows a breast cancer after codetection of hsa-miR-302a and BMI1. The Nuance system converted the images to green (BMI1, panel D), blue (hsa-miR-302a, panel E) and then merged, such that cells coexpressing both are in yellow false color (panel F); 400X magnification. Note that several of the hsa-miR-302a–positive cells also coexpress BMI1. The small insert on the top left corner of panel F is a negative control where BMI1 antibody was used together with the scrambled microRNA probe; note the absence of yellow. The scale bar in each panel is 75 micrometers.

