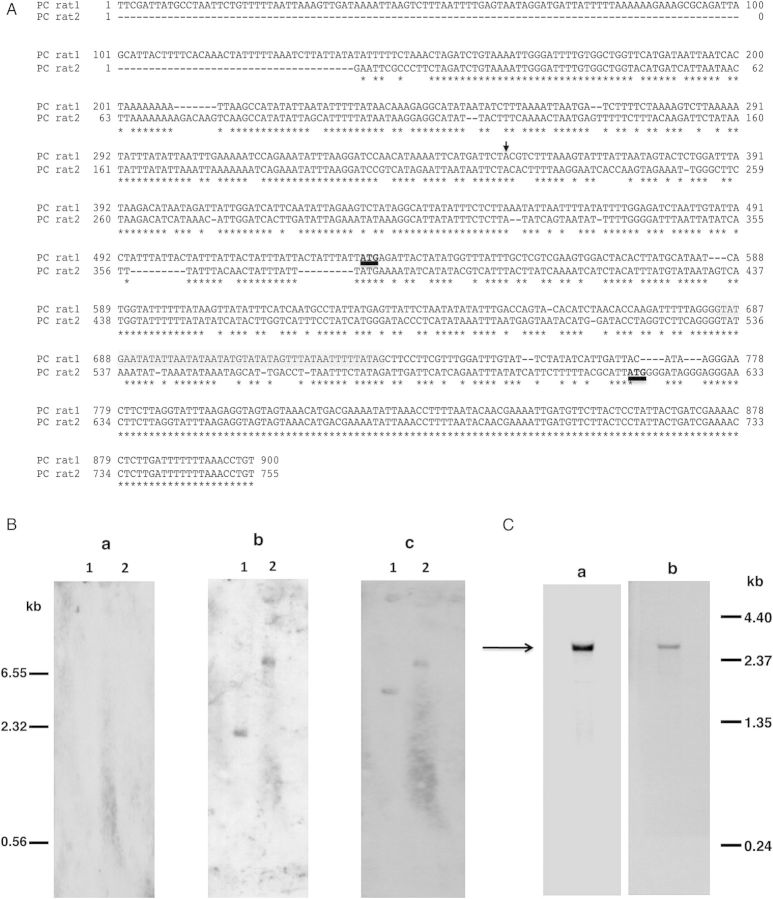
Figure 1.
A, Alignment of 5′-region of P. carinii eng (PC rat1) sequence with the published sequence (PC rat2) [12]. The translation start site, ATG, is shown in bold and underlined. Conserved sequences are denoted by the asterisks and the intron is highlighted in gray. The transcription start site is indicated by the arrow. B, Southern blot analysis of P. carinii genomic DNA. Genomic DNA extracted from partially purified P. carinii organisms was digested with Xba1 (lane 1) or EcoR1 (lane 2). The blot was hybridized successively with 3 different digoxigenin-labeled oligonucleotides, with stripping of the blot between hybridizations. No hybridization signal was observed with oligonucleotide GK28pc designed from PC rat2 (panel a). Oligonucleotide GK29pc designed from PC rat1 hybridized to a single band with both Xba1 and EcoR1 digests (panel b). Also, oligonucleotide GK19pc designed from the 3′-end common to ratpc1 and ratpc2, hybridized to a single band with both Xba1 and EcoR1 digests (panel c). An internal restriction site accounts for the size differences in the bands that hybridized with the 5′-end and the 3′-end oligonucleotides in the Xba1 digests. C, Northern blot analysis of total RNA from P. carinii. (Panel a) Hybridization with oligonulceotide GK29pc resulted in a band of approximately 2.6 kb (indicated by the arrow). (Panel b) The blot in panel a was hybridized, after stripping, with oligonucleotide GK19pc, giving an RNA band of the same size as in panel a.

