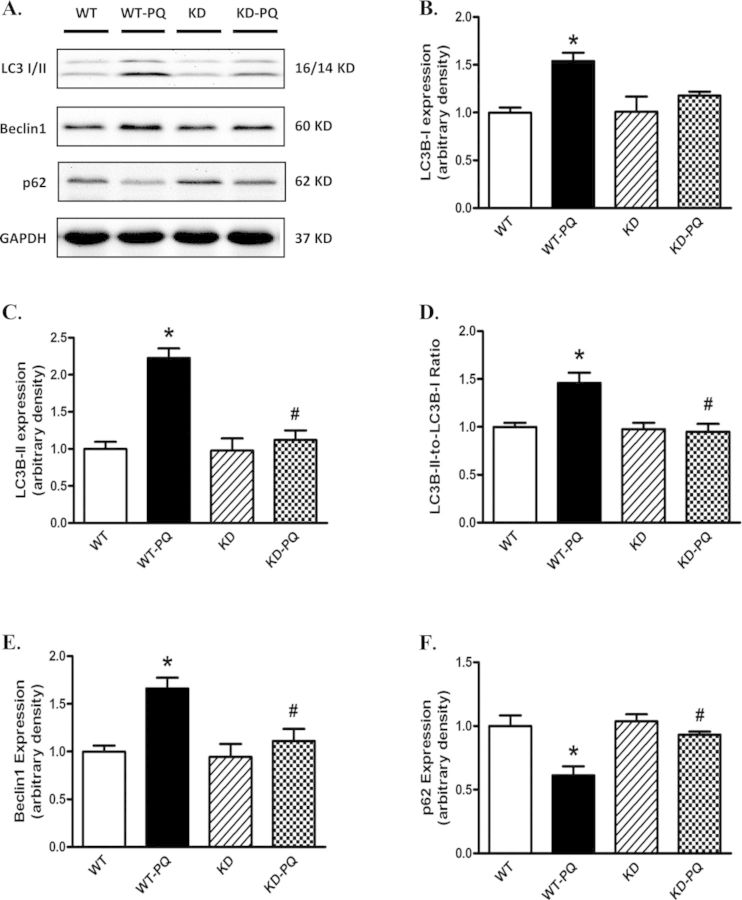
FIG. 5.
Western blot analysis of autophagy markers in heart from WT and KD mice treated with or without paraquat (45 mg/kg, i.p.) or vehicle for 48 h. (A) Representative gel blots depicting LC3 I, LC3 II, p62, Beclin-2, and GAPDH (loading control) using specific antibodies. (B) LC3 I expression; (C) LC3 II expression; (D) LC3 II-to-LC3 I ratio; (E) Beclin-1 expression; and (F) p62 expression. Mean ± SEM, n = 4–5; *p < 0.05 versus WT group, #p < 0.05 versus WT-paraquat group. Gel density of all groups was normalized with the respective gel density of WT group.

