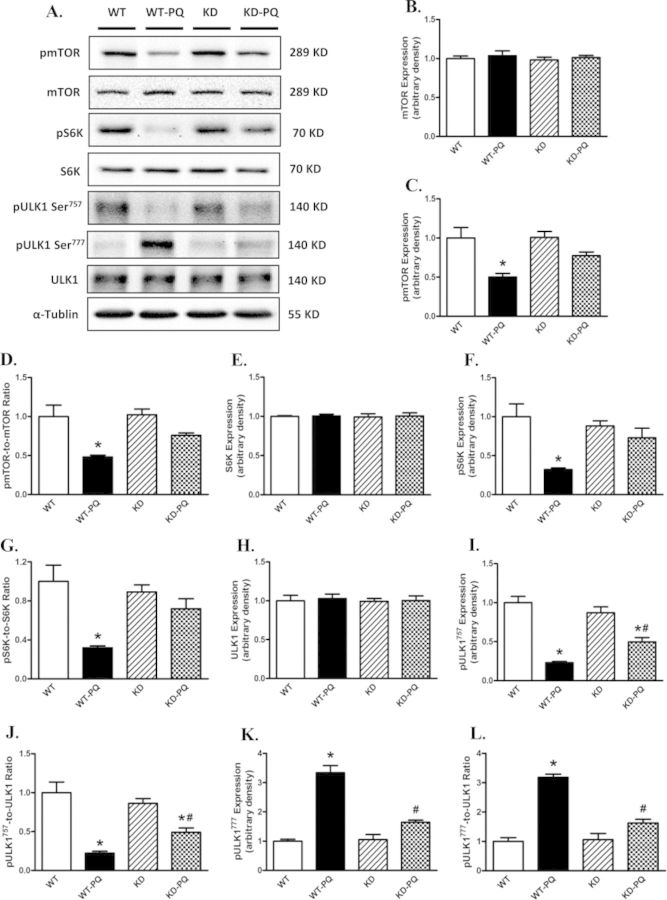
FIG. 7.
Western blot analysis of mTORC1-related autophage signaling proteins from WT and KD mice treated with or without paraquat (45 mg/kg, i.p.) or vehicle for 48 h. (A) Representative gel blots depicting mTOR, phospho-mTOR (pmTOR, Ser2448), S6K, phospho-S6K (pS6K, Ser792), ULK1, phosphoULK1 (pULK1, Ser757 and pULK1, Ser777), and α-tubulin (loading control) using specific antibodies; (B) pan mTOR; (C) pmTOR; (D) pmTOR-to-mTOR ratio; (E) pan S6K; (F) pS6K; (G) pS6K-to-S6K ratio; (H) pan ULK1; (I) pULK1 Ser757; (J) pULK1757-to-ULK1 ratio; (K) pULK1 Ser777; (L) pULK1777-to-ULK1 ratio. Mean ± SEM, n = 4–5, *p < 0.05 versus WT group, #p < 0.05 versus WT-paraquat group. Gel density of all groups was normalized with the respective gel density of WT group.

