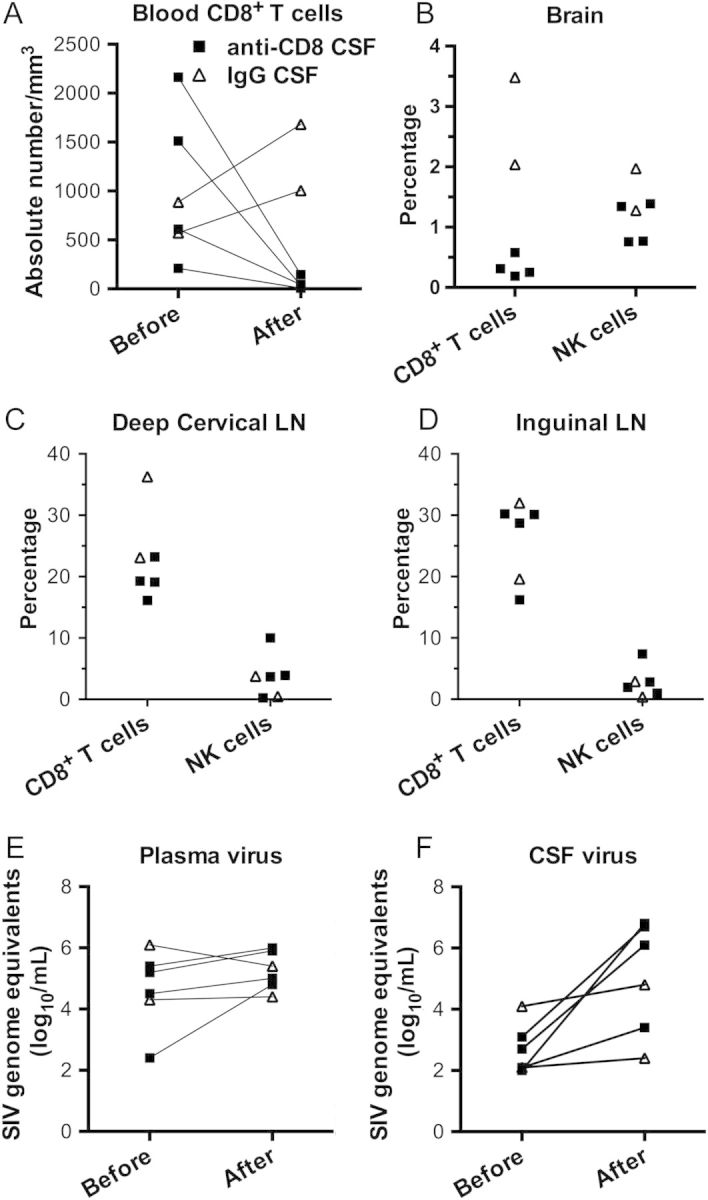
Figure 1.

Effect of anti-CD8 treatment in the cerebrospinal fluid (CSF) on immune cells and virus. A–D, Quantification of cells in individual animals, with the indicated treatment protocol, as determined by flow cytometry. A, CD8+ T-cell counts in blood are shown before and after treatment. B, Brain CD8+ T cell and natural killer (NK) cell proportions are shown at necropsy. C and D, CD8+ T cell and NK cell proportions in deep cervical and inguinal lymph nodes (LNs) are shown at necropsy. E and F, Quantification of simian immunodeficiency virus (SIV) load in plasma and CSF specimens obtained from animals before and after the indicated treatment.
