Figure 2.

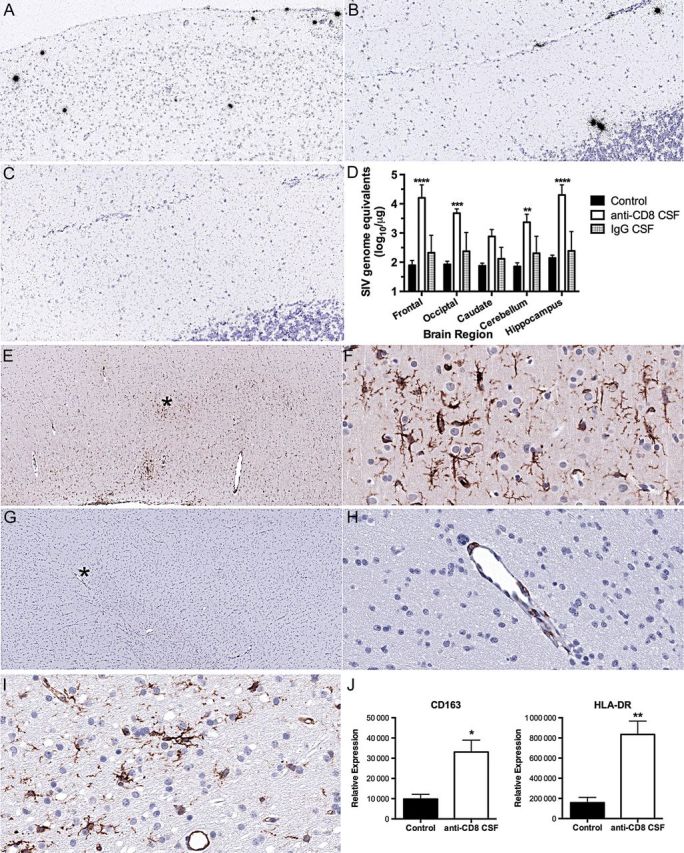
Receipt of anti-CD8 treatment in the cerebrospinal fluid (CSF) induces viral expression and microglial activation. A–C, In situ hybridization of brain sections. Antisense simian immunodeficiency virus (SIV) probe identifies SIV-positive cells (black silver grains) in animals treated intra-CSF with the CD8-depleting antibody but not in animals treated intra-CSF with control immunoglobulin G (IgG). A, Photomicrograph (10× original magnification) from frontal lobe of anti-CD8 treated monkey. B, Photomicrograph (20× original magnification) from the cerebellum of an anti-CD8–treated monkey. C, Photomicrograph (20× original magnification) from the cerebellum of control IgG–treated monkey. D, SIV load measured in RNA from different regions of the brain. Mean and standard deviation are indicated for the 3 untreated animals (black columns), the 4 receiving intra-CSF anti-CD8 (unfilled columns), and the 2 receiving intra-CSF IgG (gray columns; not used in statistical analysis). Samples below the limit of detection were assigned the value of the limit of detection (1.73 log10/µg RNA). Two-way analysis of variance revealed a significant effect of treatment (P = .0018). Comparisons between groups were performed using the Bonferroni multiple comparisons test, with significant differences between the intra-CSF anti-CD8–treated group and the control untreated group indicated. Values indicate mean and standard error of the mean (SEM). ****P < .0001, ***P < .001, and **P < .01. E–I, Immunohistochemical staining of frontal lobe brain sections for microglial activation markers. E and F, CD163 reactivity in an animal treated intra-CSF with the CD8-depleting antibody. The image in panel E is at low (4× original) magnification. The asterisk indicates the area shown in panel F at high (40× original) magnification, revealing reactive ramified microglia. G and H, CD163 reactivity in animal treated intra-CSF with control IgG. The image in panel G is at low (4× original) magnification. The asterisk indicates the area shown in panel H at high (40× original) magnification, revealing only reactive perivascular macrophages. I, HLA-DR reactivity in an animal treated intra-CSF with the CD8-depleting antibody, revealing reactive ramified microglia, as well as endothelial cells (note the blood vessel). The photomicrograph is at high (40× original) magnification. J, Quantification by real-time polymerase chain reaction of microglia activation markers in RNA from the frontal lobe of untreated SIV-infected (control) and intra-CSF anti-CD8–treated animals. Values indicate mean and SEM. **P < .01, *P < .05.
