
Figure 2.
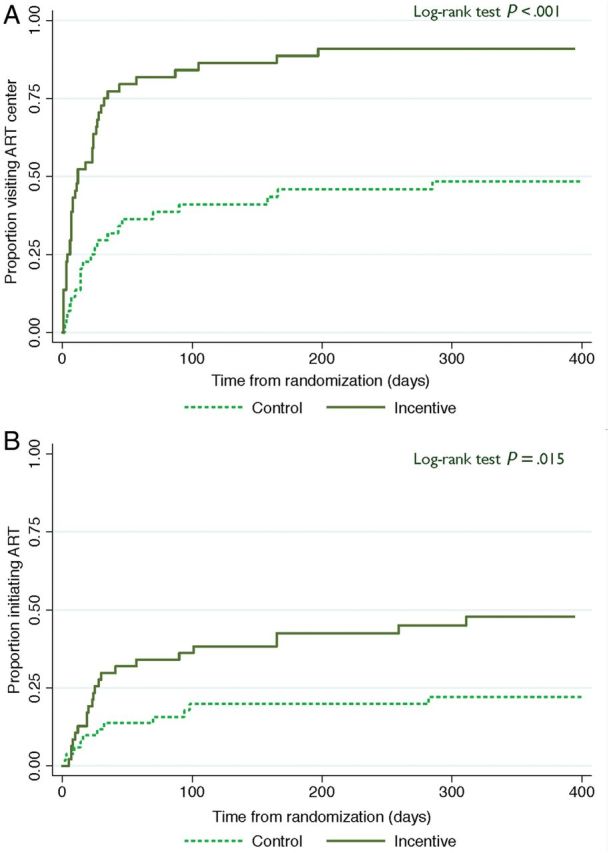
Kaplan-Meier curves of time to visiting a government antiretroviral therapy (ART) center and time to initiation of ART. A, Time to visiting a government ART center from randomization. B, Time to initiation of ART from randomization.
Official websites use .gov
A
.gov website belongs to an official
government organization in the United States.
Secure .gov websites use HTTPS
A lock (
) or https:// means you've safely
connected to the .gov website. Share sensitive
information only on official, secure websites.
Kaplan-Meier curves of time to visiting a government antiretroviral therapy (ART) center and time to initiation of ART. A, Time to visiting a government ART center from randomization. B, Time to initiation of ART from randomization.