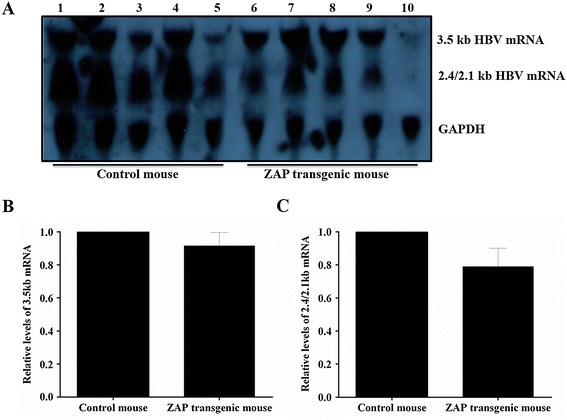
Figure 1.

The transcription levels of HBV RNA in mouse liver tissue. (A): Lanes 1-5 for ICR control mouse and lanes 6-10 for ZAP transgenic mouse. (B): Quantitative analysis results of the 3.5-kb HBV mRNA. (C): Quantitative analysis results of the 2.4/2.1-kb HBV mRNA. The mean value of ICR control mouse was defined as 1, and GAPDH was used as internal control.
