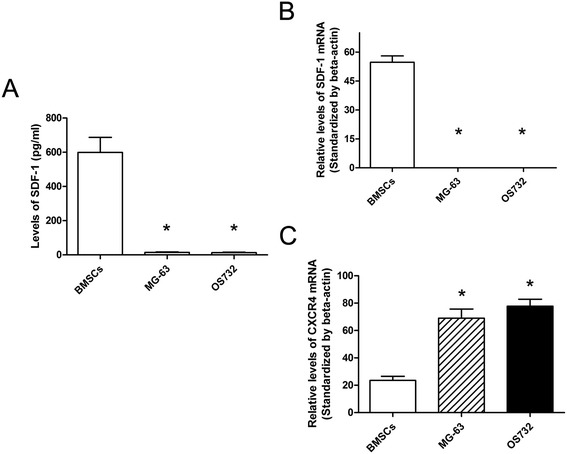
Figure 3.

SDF-1 secretion and SDF-1 and CXCR4 expression. (A) The SDF-1 concentration in the BMSC supernatant as detected by ELISA. BMSCs had significantly higher levels of SDF-1 compared to MG-63 and OS732 cells. (B) The RT-PCR analysis of SDF-1 mRNA expression in osteosarcoma cell lines and BMSCs. (C) The RT-PCR analysis of CXCR4 mRNA expression in osteosarcoma cell lines and BMSCs. (*P < 0.01 compared to the BMSCs).
