
Figure 4.
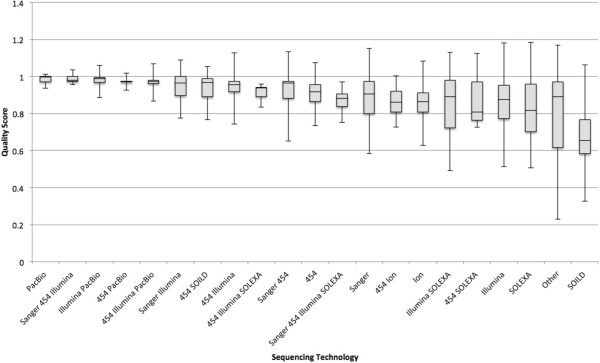
Box and whiskers plot of average score by sequencing technology. Where available, a sequencing technology was parsed from GenBank and PATRIC sources. Data are sorted left to right from largest to smallest mean value. The box represents the first quartile, the mean, and the third quartile. The whiskers represent 2 standard deviations on either side of the mean. Because the data have an upper limit of 1, the upper range can exceed the possible values.