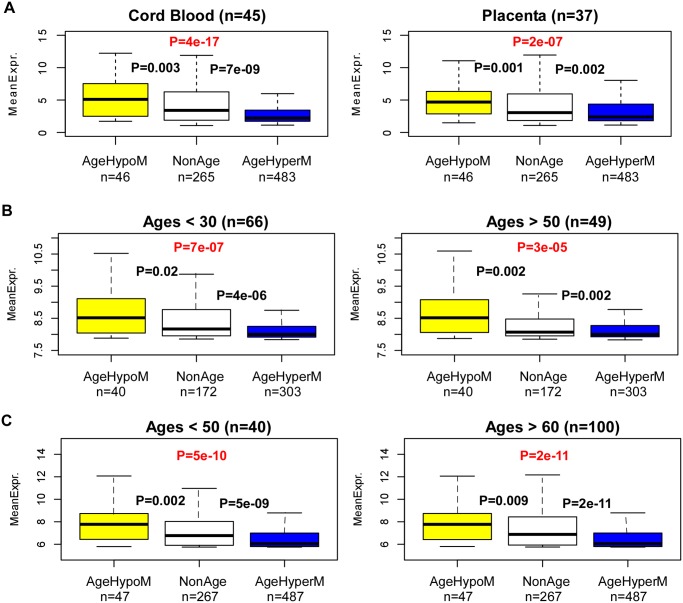
Fig 4. Age-associated hypermethylation (hypomethylation) targets lowly (highly) expressed genes.
A) Boxplots of mRNA expression levels in cord blood and placenta samples, for three sets of genes: (i) genes undergoing age-associated hypomethylation in their CGI promoters (AgeHypoM), (ii) genes not undergoing any age-associated DNAm changes (NonAgeDMR), and (iii) genes undergoing age-associated hypermethylation in their CGI promoters (AgeHyperM). P-values shown between groupds are from a Wilcoxon-rank sum test comparing the respective neighboring gene classes. The number of genes in each class is indicated below plot. The P-value from a linear regression of expression against gene-class is also indicated in red. B) Left panel: As A) but for the whole blood samples of de Jong et al 2014, for individuals under the age of 30. Right panel: As left panel, but now for 49 whole blood samples from people over the age of 50. C) As B) but now for the expression data set of Beineke et al 2012.

