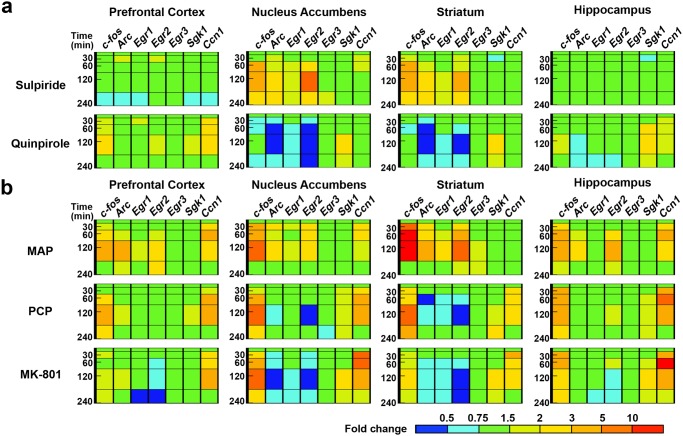
Fig 3. D2R antagonist shows spatial TFPs homologous to those by antipsychotics, while D2 agonist and propsychotic agents exhibit their peculiar TFPs.
TFPs of seven IEGs over time induced by D2R antagonist/agonist and propsychotic drugs in mouse brain; (a) Selective D2R antagonist sulpiride (100 mg/kg, i.p.) and agonist quinpirole (10 mg/kg, i.p.), and (b) Propsychotic agents MAP (3 mg/kg, s.c.), PCP (10 mg/kg, s.c.) and MK-801 (1 mg/kg, s.c.). The bar depicted in the bottom right corner represents the expression level of the gene searched in a TFP. Red represents high expression, green represents vehicle-control level expression, and blue represents low expression.

