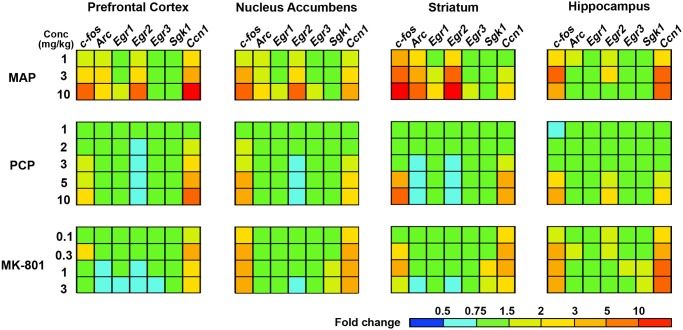
Fig 4. TFPs of seven IEGs by treatment of propsychotic agents showing dose-response pattern in mouse brain.
Significant reduction of Egr2 in nucleus accumbens, striatum and prefrontal cortex, and increases of c-fos and Ccn1 in all tested regions are characteristic of NMDA antagonists, whilst MAP serves robust IEGs induction in all four regions studied here. The bar depicted in the bottom right corner represents the expression level of the gene searched in a TFP. Red represents high expression, green represents vehicle-control level expression, and blue represents low expression. Propsychotic agents; MAP (1 hr treatment, 1 mg/kg to 10 mg/kg, s.c.), PCP (1 hr treatment, 1 mg/kg to 10 mg/kg, s.c.), MK-801 (1hr treatment, 0.1 mg/kg to 3 mg/kg, s.c.).

