Figure 1.

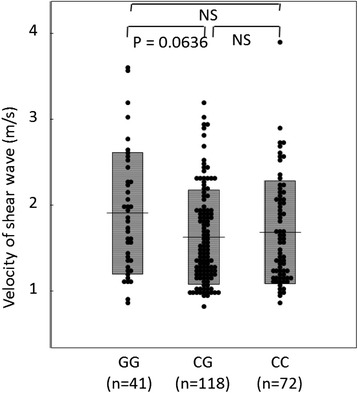
Vs values among PNPLA3 genotypes. Vs values tended to be higher for patients with GG than for those with CG (p = 0.0636) and was higher than for those with CC, although there was no statistically significant difference.

Vs values among PNPLA3 genotypes. Vs values tended to be higher for patients with GG than for those with CG (p = 0.0636) and was higher than for those with CC, although there was no statistically significant difference.