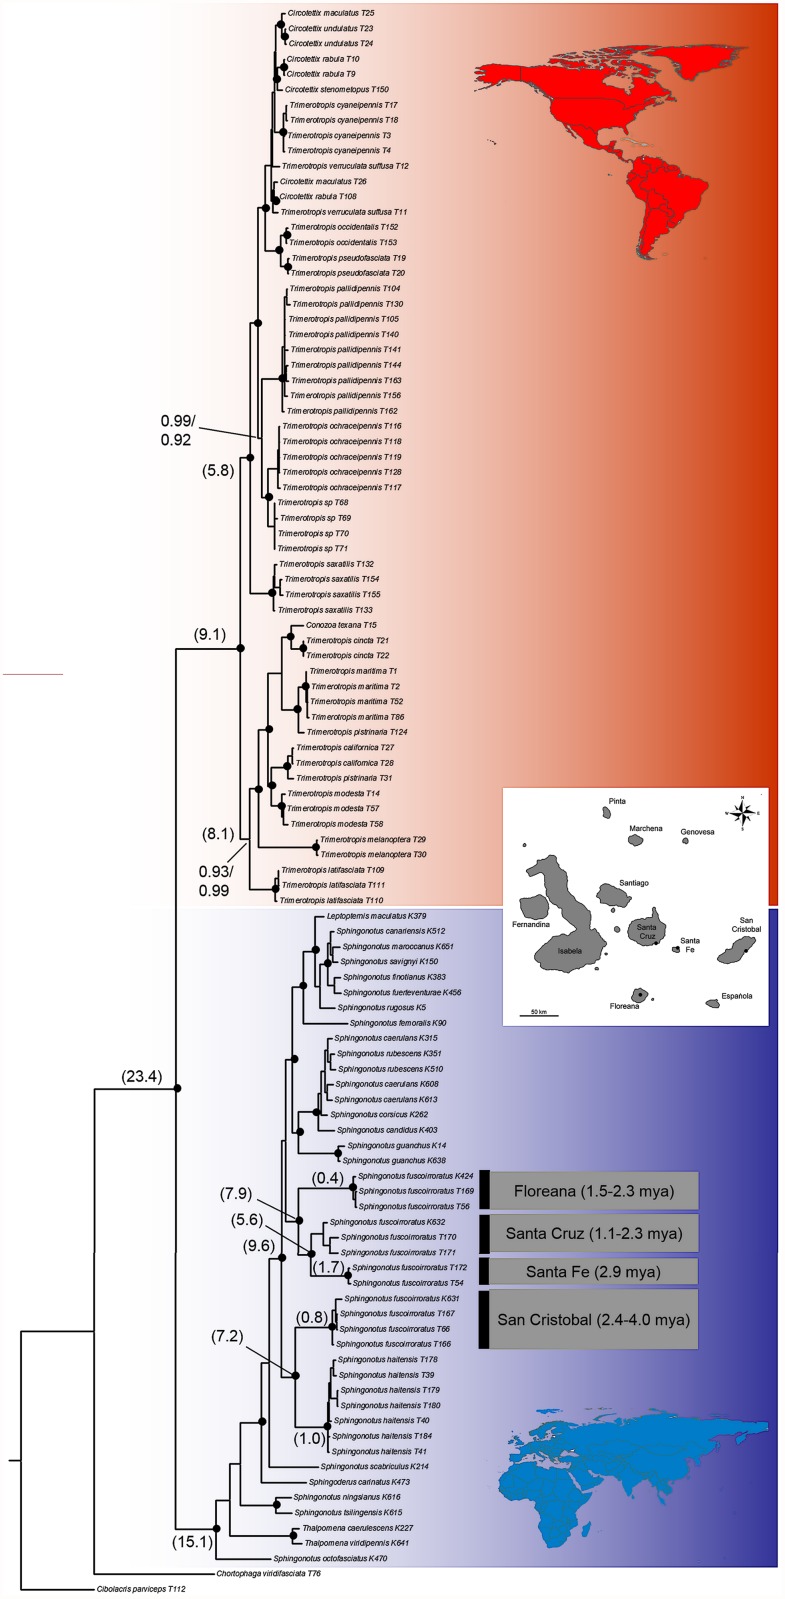
Fig 1. Phylogenetic tree resulting from Bayesian analysis of the combined data set of three genes.
Red color indicates the New World Trimerotropini, blue are the Old World Sphingonotini. Black circles represent posterior probabilities ≥ 0.95 in both analyses. Numbers are posterior probabilities below 0.95 for at least one of the analyses (upper value from BEAST analysis, lower value from MrBayes analysis). The numbers in parentheses represent the divergence time estimates derived from the BEAST analysis. Only the values for main branches of interest are shown and no intraspecific values are presented. Estimates of minimum and maximum emergence times of the studied islands in parentheses next to island names were taken from Geist and colleagues [5].

