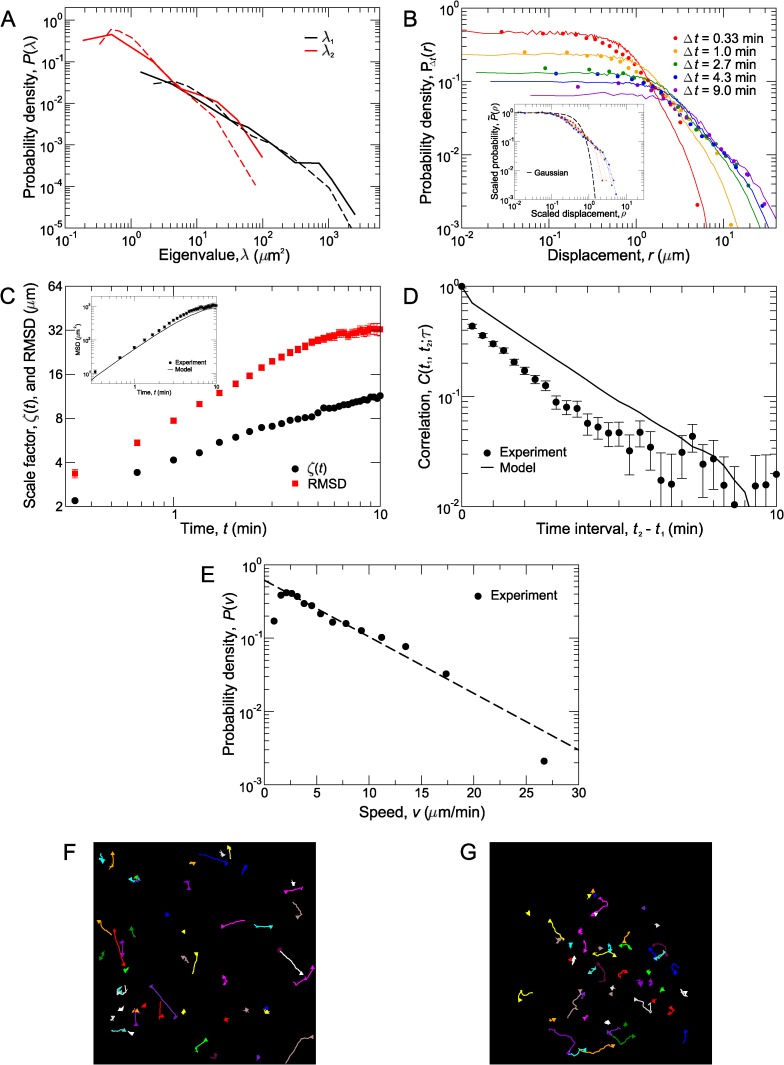
Figure 3. Analysis of T cell migration.
(A) The experimentally observed distributions of eigenvalues, λ 1 and λ 2, for individual track moment of inertia tensors, I n (black and red solid lines, respectively). The distributions of track eigenvalues for the two populations walk model agree well (dashed lines) with experiment. (B) Drift-corrected probability distributions, P(r(t)), of T cell displacements, r(t), at various times, t (circles) and probability distributions of simulated cell displacements (solid lines). Inset: The scaled distributions, , of ρ = r/ζ, of T cell displacements fall on one curve (circles) at small ρ. This is clearly not a single Gaussian distribution (dashed line). Colored dotted lines in the inset are a guide for the eye to more clearly see systematic deviations from perfect scaling collapse at large ρ. (C) The scaling factor, ζ(t) (black circles), and RMSD (red squares) as a function of time. Initially, these grow faster than , but at intermediate to late times, they approach the scalings expected for long-time diffusive behavior. The slopes are different on the log-log plot, indicating that ζ(t) and the RMSD have different time dependences and are not proportional to each other. Inset: The MSD of walkers in the model (line) agrees well with the experimentally observed MSD (circles). (D) Normalized correlations, C(t 1, t 2;τ), between the displacements and (which occur over the time intervals t 1 < t < t 1+τ and t 2 < t < t 2+τ, respectively), plotted as a function of t 2 – t 1. C(t 1, t 2;τ) for T cells (circles) initially drops sharply, and then decays as a straight line on the semi-logarithmic plot, indicating exponential decay. At long time intervals, t 2 – t 1, there are deviations from exponential decay. The model (line) agrees qualitatively. Although the magnitude of normalized correlations is greater, the correlations have the same functional dependence and decay with the same persistence time. Error bars in (C) and (D) show SEM. (E) Experimentally observed instantaneous speed distribution, P(v) (circles). This is estimated by the distance traveled over 20 s, the time between imaging frames. Dashed line is an exponential decay, , where v 0 = 5.63 μm/min. (F) Simulated trajectories for walkers in our model projected into 2D. (G) Experimentally observed trajectories of T cells in uninflamed lymph nodes.

