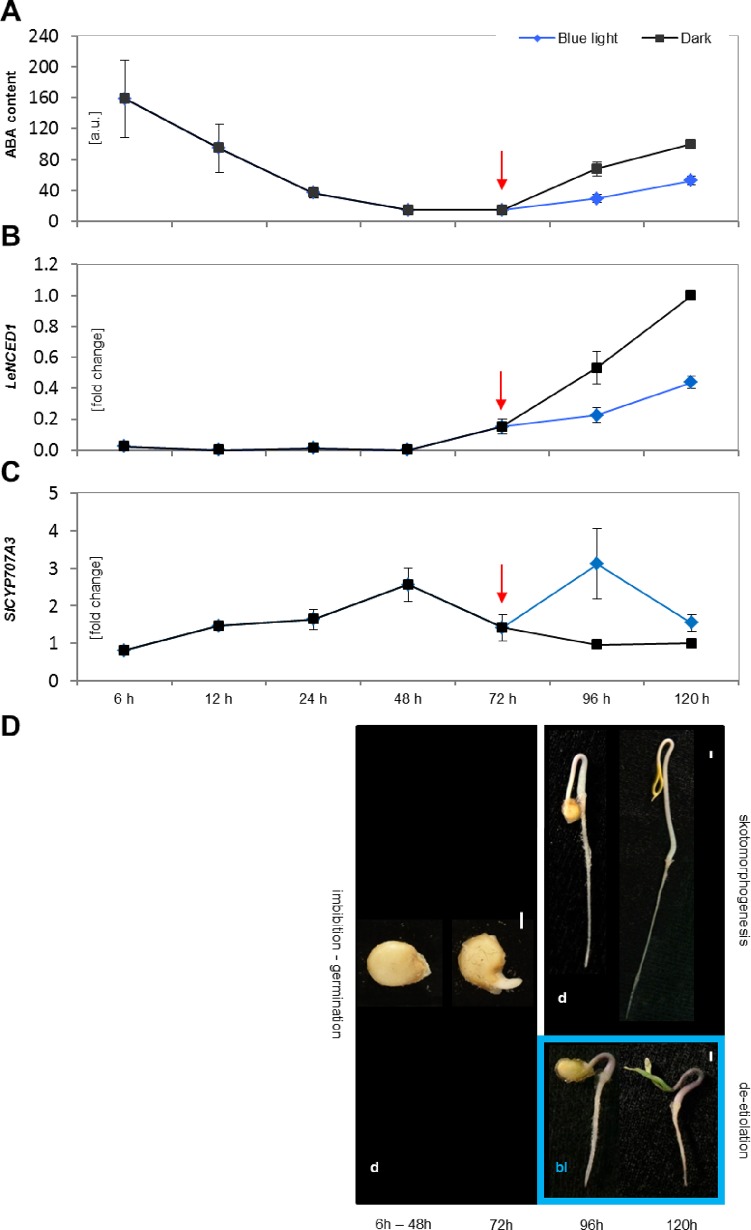
Fig 5. Regulation of ABA metabolism during seed germination and post-germination growth.
Free ABA levels are reported as relative means [a.u.] ± SE based on three independent experiments. All values are expressed relative to those for the dark-grown sample at the 120 hours time point, which was assigned a value of 100 a.u. (A). The fold changes in the expression of the LeNCED1 (B) and SlCYP707A3 (C) genes are reported as the means of three independent experiments ± SE. Tip41like and PP2ACs were used as housekeeping genes. Relative quantification was performed using the expression levels for the dark-grown sample at 120 hours as a reference. The red arrow marks the point of seed germination. Figure D) shows the different stages of tomato seedling development considered in this work. The first is seed imbibition (6h–48h), which is followed by seed germination (72h). Both of these steps occurred in darkness in all experiments. The seedlings were then separated (96h–120h) into two groups: one was kept in darkness (d) to induce skotomorphogenesis while the other was grown under continuous BL (bl) to induce de-etiolation. White bars indicate a distance of 1 mm.

