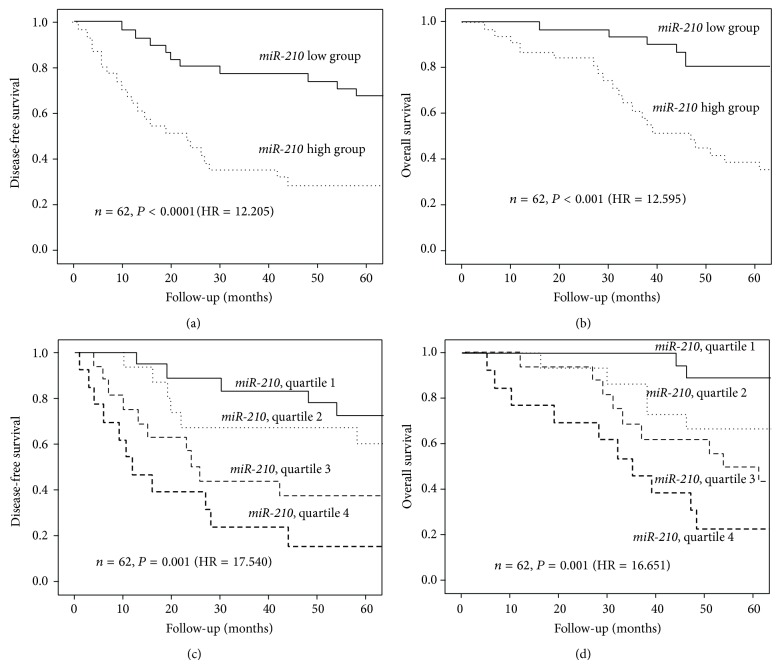
Figure 2.
Kaplan-Meier survival curves for patients with adenocarcinoma (n = 62). Kaplan-Meier curves were constructed of the following: (a) disease-free and (b) overall survival of 62 patients with adenocarcinoma stratified according to miR-210 levels. Expression levels were stratified by the median value; follow-up was limited to 60 months. (c) Disease-free and (d) overall survival of patients with adenocarcinoma stratified according to miR-210 levels. Expression levels were stratified by quartiles; follow-up was limited to 60 months.

