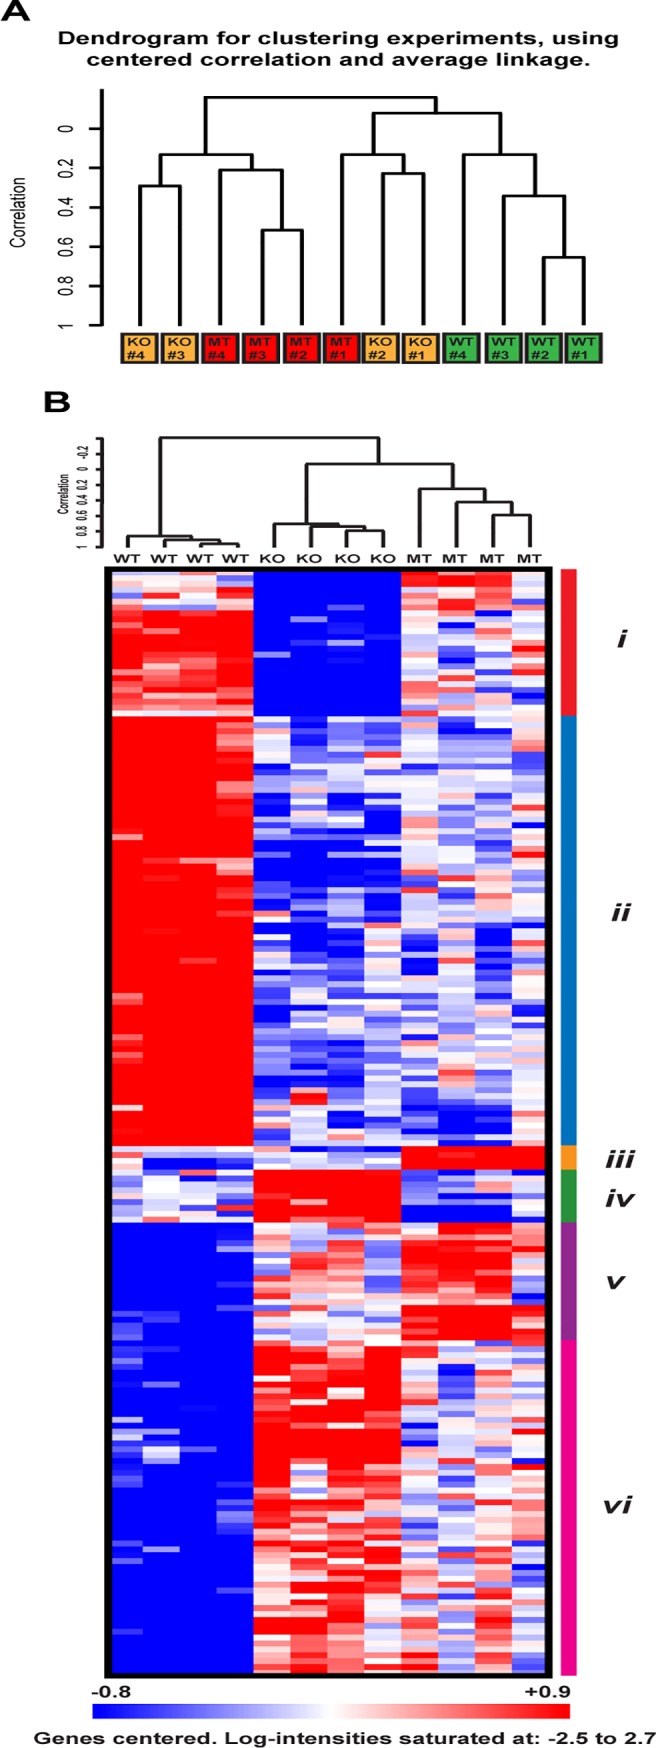
Fig 6. Gene expression profiling analysis of salivary tumors with different p53 status.

(A) Unsupervised hierarchical clustering of MMTV-Hras/p53 +/+ (green), MMTV-Hras/p53 -/- (yellow), and MMTV-Hras/p53 R172H/R172H (red) tumors based on gene expression profiling. (B) Heatmap of the identified 188 genes through the multi-class comparison function of SAM with a low 1% False Discovery Rate (FDR) and hierarchical clustering. Red represents higher expression levels and blue represents lower levels, while white represents intermediate levels. The 6 sub-clusters identified through visual inspection are marked by color bars on the right (i-vi).
