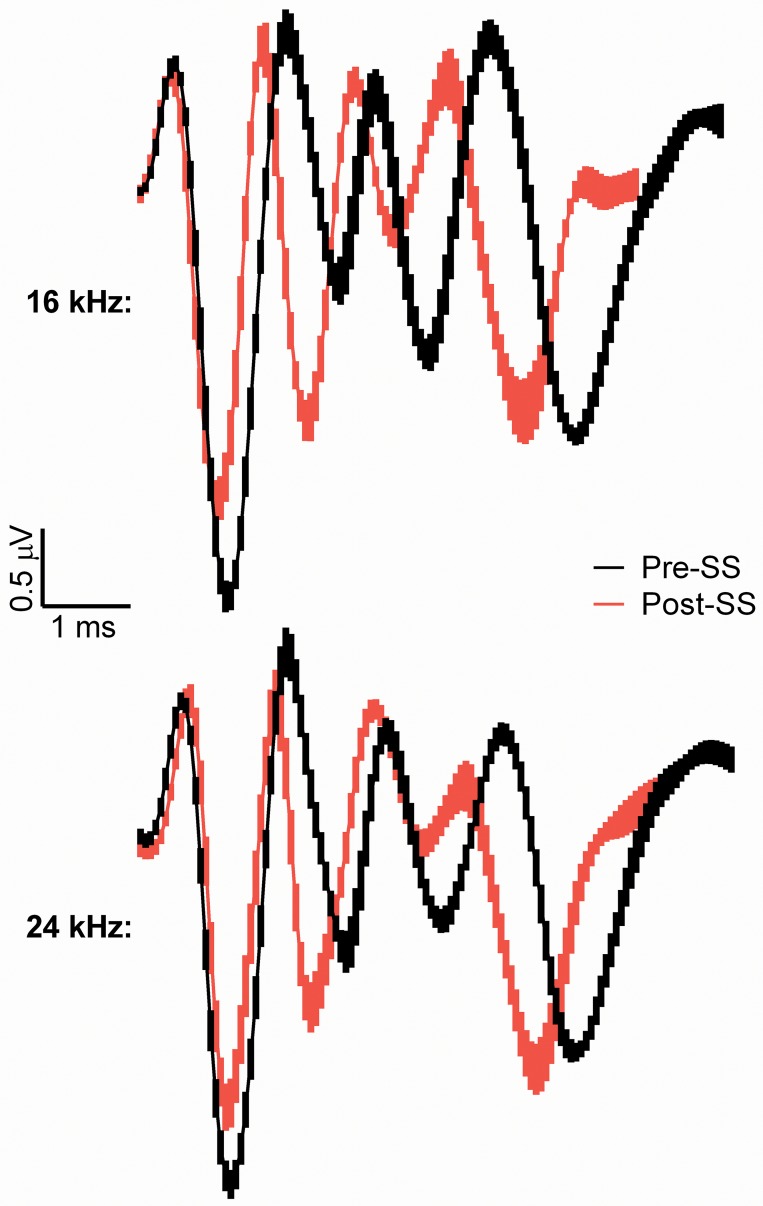
Fig 6. Grand average ABR waveforms (N = 8) prior to (black) and following (red) SS-induced tinnitus and elicited by the second 70 dB SPL noise burst (NB2) following a 50 ms silent gap. NB2 grand averages are shown to the 16 and 24 kHz stimuli.
Waveforms were aligned along P1 before averaging, and SEM is shown as the thickness of the line. SS significantly decreased the peak to trough amplitude of P1 for 16 kHz but not 24 kHz (shown in Fig. 8), and significantly decreased the latency of P4 (shown in Fig. 9).

