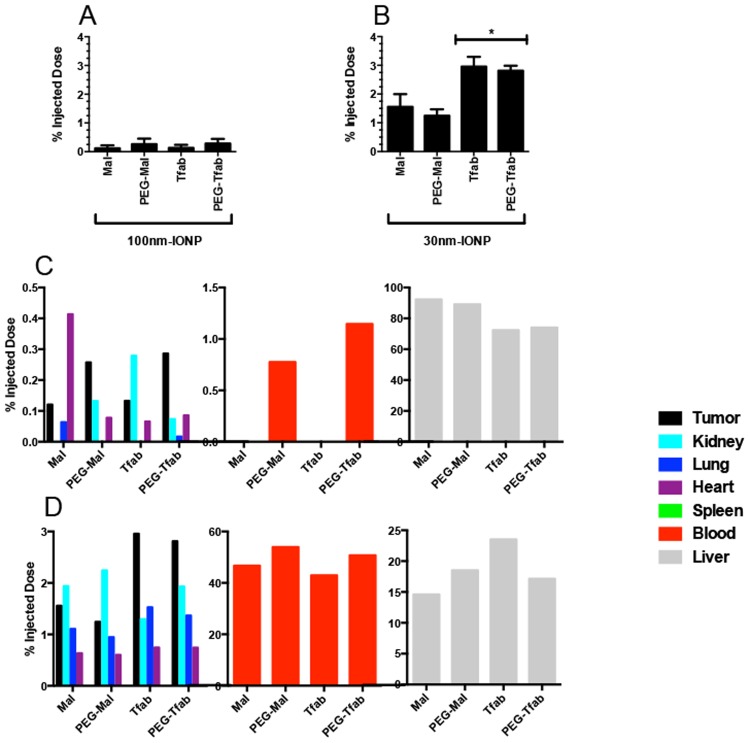
Fig 5. Percent injected IONP dose recovered during in vivo biodistribution studies.
Percentages based on raw values from Fig. 4. (A) Tumor recovery of 100 nm IONP. Values are not statistically significant relative to background. (B) Tumor recovery of 30 nm IONP. (C) Recovery of 100 nm IONP from seven different harvested tissues. Liver = grey; blood = red; tumor = black; kidney = cyan; lung = blue; spleen = green; heart = purple. Note the discontinuous y-axis. (D) Recovery of 30 nm IONP from seven different harvested tissues. Mean values from N = 4 to 7 mice per group. Error bars in A and B are standard deviation. Statistical significance (P<0.05) was analyzed by one way ANOVA with a Dunnett comparison posttest.

