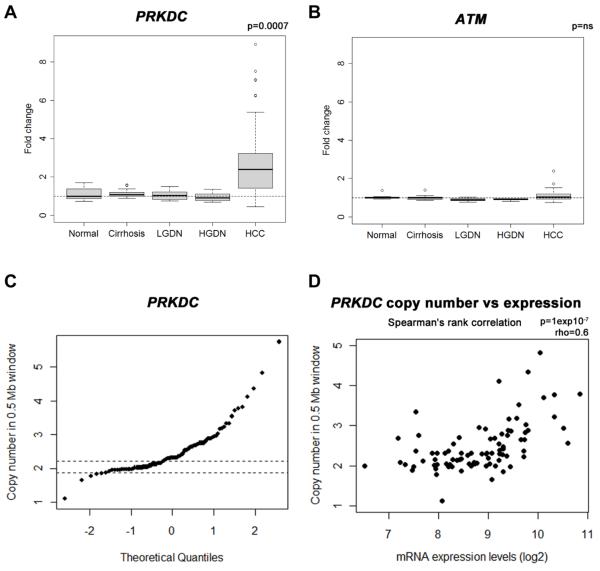
Figure 1. Increased PRKDC in HCC and amplification at the DNA locus.
PRKDC (a) and ATM (b) mRNA expression levels were analysed in 132 Human liver tissues using Affymetrix U133 Plus 2.0 arrays and expressed as fold change relative to normal liver. Tissues included normal liver (n=10), cirrhotic liver (n=13), low grade dysplastic nodules (LGDN; n=10), high grade dysplastic nodules (HGDN; n=8) and HCV-related HCC (n=91), PRKDC was significantly elevated in HCC; p=0.0007. Tumour PRKDC locus copy number was determined using the Affymetrix 500K Human Mapping Array (c). The maximum value of paired cirrhotic samples was used as a cut-off (mean DNA copy number in 0.5Mb around PRKDC gene locus, cut-off 2.25). Panel (d) shows the relationship between PRKDC locus copy number and mRNA levels (Spearman’s rank correlation ρ=0.6; p = 10−7).

