
Figure 3.
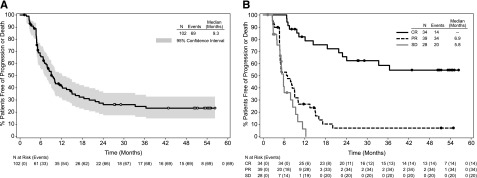
PFS following treatment with brentuximab vedotin. PFS was analyzed using Kaplan-Meier methodology and is shown overall (A) and by best response (B). All censored patients are indicated by dots on the Kaplan-Meier curve. Patients still on study and in remission without the start of new therapy are indicated by open dots on the Kaplan-Meier curve in panel A. One patient was not evaluable for response and is excluded from panel B.