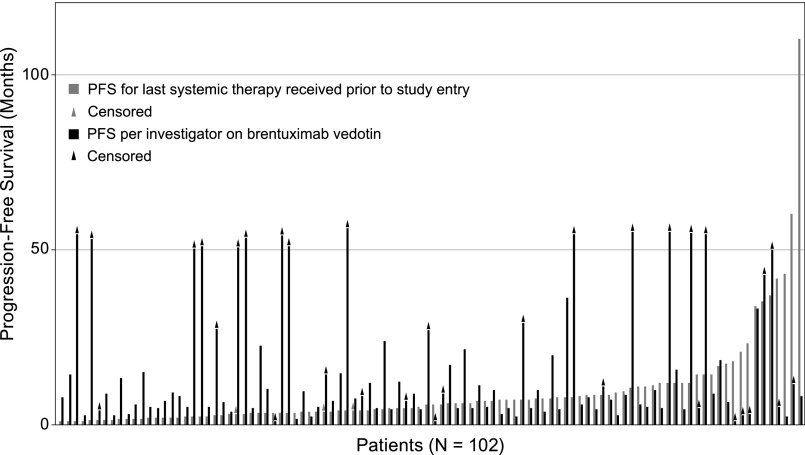
Figure 4.
PFS relative to most recent prior therapy. Includes all enrolled patients (N = 102). PFS was analyzed using Kaplan-Meier methodology and was calculated for each patient’s last systemic therapy received prior to study (gray bar) and on brentuximab vedotin (black). Triangles at the end of bars indicate censored patients. Patients are sorted left to right on the x-axis according to the duration of PFS on their last systemic therapy. Sixty-five patients (64%) had longer PFS on brentuximab vedotin than their last prior therapy.

