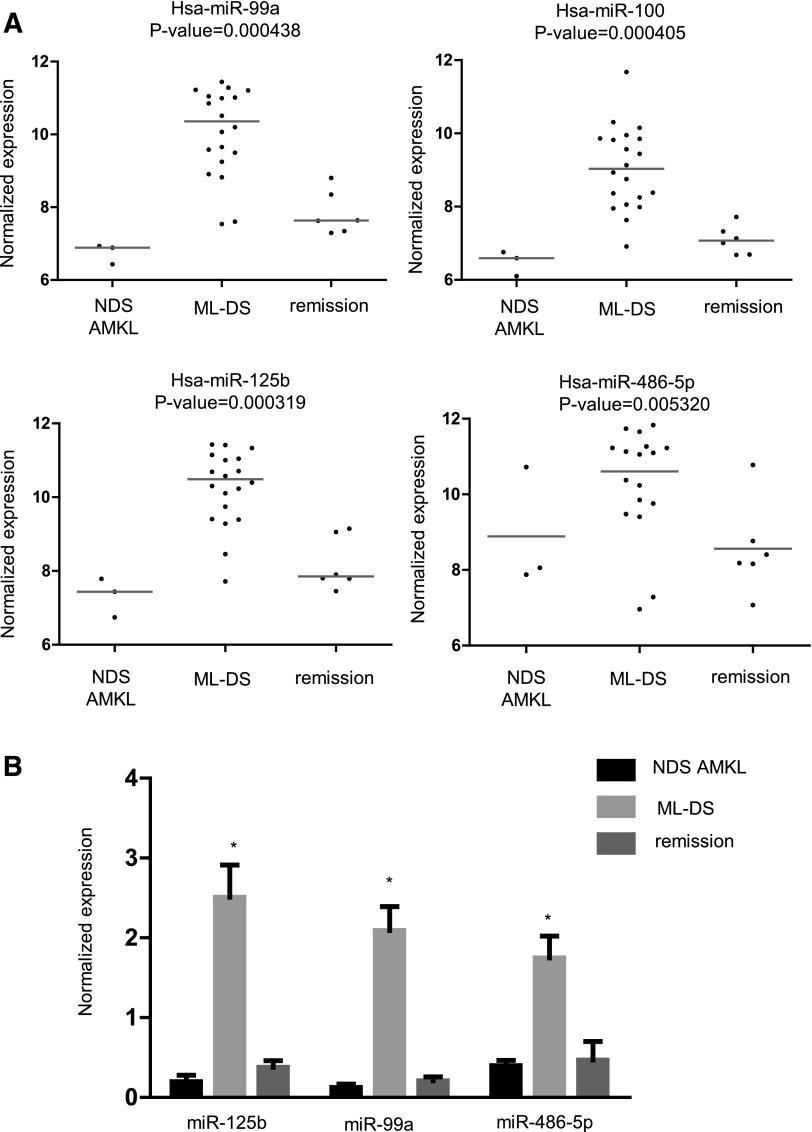
Figure 1.
miR expression in ML-DS. (A) Relative expression of 4 miRs that were found to be significantly overexpressed in diagnostic BM of ML-DS compared with NDS AMKL and DS BM remission samples. Relative expression is shown as log2 of the normalized fluorescence signal. (B) Independent validation by qRT-PCR on RNA derived from diagnostic BM samples of 36 ML-DS and 7 NDS-AMKL patients, and 12 DS BM remission samples. Expression values were normalized to the average expression of RNU19 and RNU43 endogenous controls. Standard errors are indicated. *P < .01, ANOVA.

