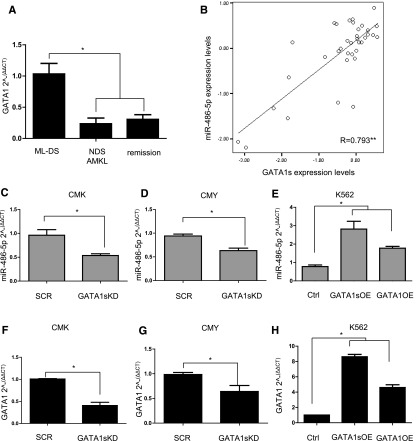
Figure 2.
Regulation of miR-486 expression by GATA1s. (A) GATA1 mRNA levels in diagnostic BM cells from ML-DS (n = 36) compared with NDS-AMKL (n = 12) and remission (n = 7). Only the GATA1s isoform is expressed in ML-DS, while the expression levels represent both isoforms in the other samples. *P < .01, ANOVA. (B) Pearson correlation test between the expression level of GATA1s mRNA and miR-486-5p in diagnostic BM from 36 ML-DS patients. **P < .01 level (2-tailed ANOVA). (C-E) qRT-PCR analysis for miR-486-5p expression after KD of GATA1s in CMK (C) and CMY (D) ML-DS cells, and after the OE of GATA1s or GATA1 in K562 erythroid leukemia cells (E). (F-H) qRT-PCR analysis of GATA1s or GATA1 mRNA in the leukemia cell lines after the KD or OE experiments, respectively. *P < .01 (2-tailed Student t test).

