
Figure 3.
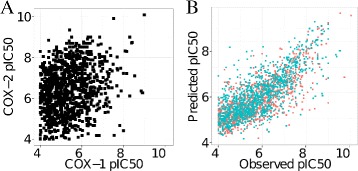
COX inhibitors selectivity on human COX-1 and COX-2. A. Scatterplot corresponding to the comparison of bioactivities against human COX-1 and COX-2 for 1,288 compounds. A large proportion of the compounds present a COX-2/COX-1 selectivity ratio between 2 and 4 pIC50 units. Therefore, the present dataset includes COX inhibitors with highly divergent bioactivity profiles for COX-1 and COX-2 (). B. Scatterplot of the observed against the predicted pIC50 values for the compounds described in A. Blue squares correspond to the activity on COX-1, whereas orange squares correspond to the activity on COX-2. The PCM models explain more than 59% of the variance (), thus highlighting the ability of the PCM models to predict the potency of compounds displaying uncorrelated bioactivity profiles on human cyclooxygenases.