
Fig. 1.
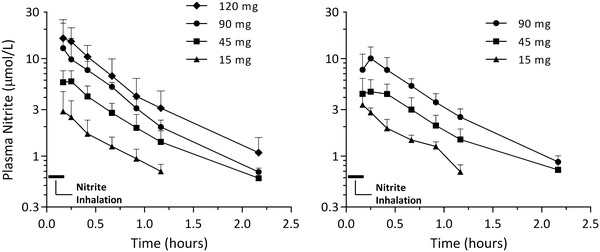
Concentration–time profiles of plasma nitrite relative to the start of a 10-min sodium nitrite inhalation in healthy male and female subjects following a single dose (left) or on day 6 (right) following a total of 16 (every 8 h) administrations in Part A of study CS04. Values represent mean (n = 3 or 6), and error bars represent standard deviation. Dosage levels represent the mass of sodium nitrite loaded into the nebulizer medication chamber. 120-mg dosage level discontinued after day 1 due to DLT in two of three subjects