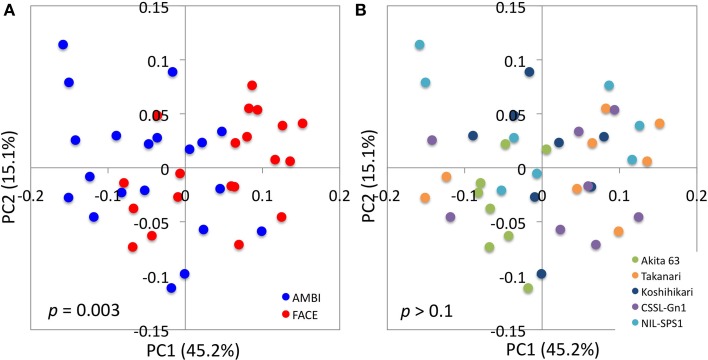
Figure 2.
UniFrac principal coordinates analysis plots illustrating the effects of the [CO2] elevation and rice cultivar on the structure of root-associated bacterial communities. Distance matrices were defined by a weighted UniFrac distance. Data points are colored according to [CO2] treatment in (A) or by rice cultivar in (B). The results of statistical tests of differences between treatments are indicated in each plot. The [CO2] × rice genotype interaction was not statistically significant (p > 0.1). PC, principal component; AMBI, ambient levels of CO2; CSSL, chromosome segment substitution line; FACE, free-air CO2 enrichment; NIL, near-isogenic line.

