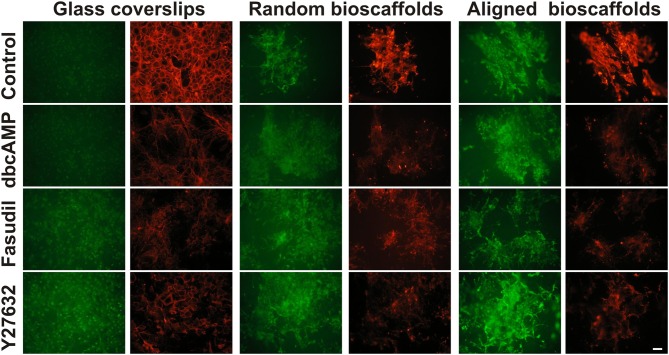
Figure 2.
Effect of drug treatments on expression of G-actin and F-actin in astrocytes cultured on different substrates. Astrocytes were treated for 72 h with vehicle (Control), dbcAMP (1 mM), Fasudil (100 μM) or Y27632 (30 μM) on glass coverslips, random or aligned bioscaffolds and labeled to reveal G-actin (green) or F-actin (red). Paired images represent the same field. Scale bar = 50 μm.

